
CON-410 · Lesson 10 of 12 · 27 min
Measuring productivity on site
Improving productivity starts with measuring it, and measuring it well. Most contractors track productivity only through the cost report: budgeted hours against actual hours, by cost code, as CON-310 lessons 4 and 5 describe. That comparison shows whether a crew is ahead or behind its estimate, but not why. A crew running 20 % over budget might be slow, might have been given a poor estimate, might be losing hours to waiting or might be doing rework. Lean practice adds measurements that look inside the crew's day: how time is actually spent, what interrupts the work and how crew members' time is balanced. This lesson covers work sampling, foreman delay surveys, crew balance charts, performance factors and learning curves, and how to use them without turning measurement into surveillance.
Three kinds of productivity measure
Productivity measures answer three different questions. Output measures, such as unit rates and performance factors, ask how much was produced for the hours spent. Activity measures, such as work sampling, ask how workers' time was used. Cause measures, such as delay surveys and reasons for missed commitments, ask what got in the way. A good productivity program uses all three: output measures to find where performance is poor, activity measures to see what is happening, and cause measures to find what to fix.
| Kind | Example measures | Question answered | Source |
|---|---|---|---|
| Output | Unit rate, performance factor, productivity index | How much did we produce per hour? | Quantities and timecards (CON-310) |
| Activity | Work sampling, five-minute rating, video analysis | How was time spent? | Observation |
| Cause | Foreman delay survey, reasons for non-completion, constraint log | What got in the way? | Forepersons and planning records |
Performance factor and productivity index
The performance factor compares the hours a piece of work should have taken, according to the budget, with the hours it actually took. CON-310 calls the budgeted hours for work completed earned hours. A performance factor above 1.0 means the crew is more productive than budgeted; below 1.0 means less. Some contractors express the same idea the other way round, as actual hours divided by earned hours, so the definition must always be stated.
Worked problem
Performance factor for the board crew
On floor 3 of Willowmere, the board crew hung 1,860 m² of drywall. The estimate allowed 0.26 worker-hours per m². Timecards show 540 worker-hours charged. What is the performance factor?
Show solution
- Earned hours = 1,860 × 0.26 = 483.6 hours.
- Performance factor = 483.6 ÷ 540 = 0.90.
Answer: The performance factor is 0.90: the crew took about 11 % more hours than budgeted. The factor alone does not say why; the next measurements help find out.
Performance factors are only as good as the budget they compare with. An estimate based on an unrealistic unit rate makes every crew look poor, and one with generous rates hides real problems. For improvement purposes, it is often more useful to track a crew's unit rate over time, against its own earlier performance and against industry or company benchmarks, than to rely on the estimate alone.
Work sampling
Work sampling estimates the proportion of time spent in different categories by making many instantaneous observations at random times. An observer walks the site on a random route at random times and records, for each worker seen, what category of activity they are doing at that instant. With enough observations, the proportion in each category estimates the proportion of time spent on it. The method was developed in the textile industry in the 1930s and has been used in construction since the 1970s.
| Category | Definition | Examples |
|---|---|---|
| Direct work | Physically adding to the product | Fastening board, pulling wire, placing concrete |
| Preparatory work | Setting up to do direct work at the workface | Measuring, layout, setting up a tool |
| Material handling | Moving materials to or at the workface | Carrying board, unloading pallets |
| Tools and equipment | Getting, moving or fixing tools and equipment | Fetching a drill, moving a lift |
| Waiting | Idle because work cannot proceed | Waiting for a hoist, an answer or another trade |
| Travel | Moving around the site without material | Walking to another floor |
| Personal | Breaks and personal time | Scheduled break, washroom |
| Rework | Correcting completed work | Removing and rehanging board |
The number of observations needed depends on the precision required. For a category whose proportion is around p, the number of observations needed to estimate it within plus or minus e at about 95 % confidence is given by the normal approximation to the binomial distribution, with z of about 1.96.
# Work sampling: observations needed and the confidence interval of the result
import math, random
z = 1.96
for p, e in ((0.40, 0.05), (0.40, 0.03), (0.15, 0.03)):
    n = math.ceil(z**2 * p * (1 - p) / e**2)
    print(f"p = {p:.0%}, precision +/- {e:.0%}: need {n} observations")

# Simulate a study of 1,100 observations on Willowmere floors 3 and 4 (seeded)
rng = random.Random(410)
true = {"direct": 0.36, "preparatory": 0.09, "material handling": 0.15, "tools/equipment": 0.07,
        "waiting": 0.13, "travel": 0.08, "personal": 0.07, "rework": 0.05}
cats = list(true)
obs = rng.choices(cats, weights=list(true.values()), k=1100)
n = len(obs)
for c in cats:
    k = obs.count(c); p = k / n
    half = z * math.sqrt(p * (1 - p) / n)
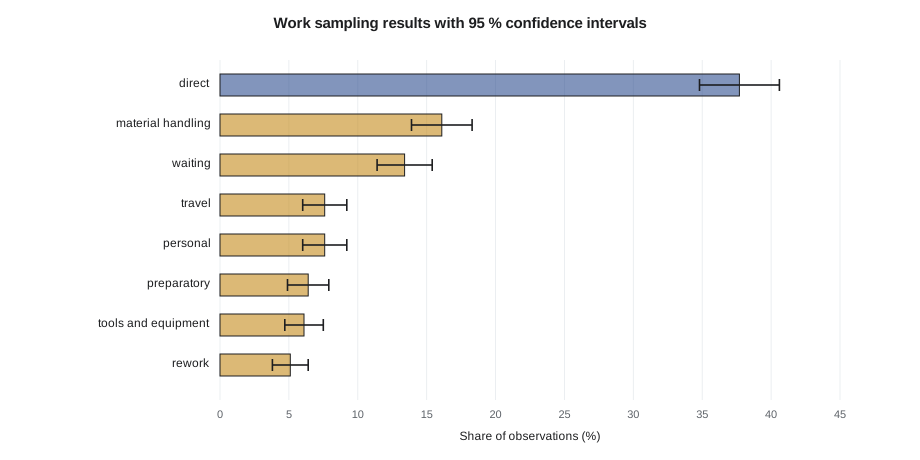
print(f"{c:<18}{k:>5} {p:6.1%} 95% CI {p - half:6.1%} to {p + half:6.1%}")p = 40%, precision +/- 5%: need 369 observations p = 40%, precision +/- 3%: need 1025 observations p = 15%, precision +/- 3%: need 545 observations direct 415 37.7% 95% CI 34.9% to 40.6% preparatory 70 6.4% 95% CI 4.9% to 7.8% material handling 177 16.1% 95% CI 13.9% to 18.3% tools/equipment 67 6.1% 95% CI 4.7% to 7.5% waiting 147 13.4% 95% CI 11.4% to 15.4% travel 84 7.6% 95% CI 6.1% to 9.2% personal 84 7.6% 95% CI 6.1% to 9.2% rework 56 5.1% 95% CI 3.8% to 6.4%
About 370 observations estimate a 40 % category within five percentage points, and about 1,000 within three. A study of 1,100 observations, which one observer can collect in a few days on a busy floor, gives intervals of roughly plus or minus three points for the largest categories. That is enough to show that waiting and material handling together take more than a quarter of the crews' time, a finding worth acting on, but not enough to detect a change of one or two points between two weeks.
Running a work-sampling study well
A work-sampling study is only valid if observations are random and categories are applied consistently. Observers should follow randomized times and routes, record what each worker is doing at the instant they are first seen rather than watching and judging, and use clear category definitions agreed in advance. The study should be explained to workers and their forepersons before it starts: its purpose is to find system problems, not to judge individuals, and results are reported for crews and categories, never for named workers. Where a union represents the workers, its representatives should be informed and, ideally, involved.
| Do | Do not |
|---|---|
| Randomize observation times and routes | Observe at the same times every day |
| Record the activity at the instant of observation | Watch a worker and decide what they are "really" doing |
| Agree category definitions in advance | Invent categories during the study |
| Explain the purpose to crews and forepersons | Observe secretly |
| Report by crew and category | Report on named individuals |
| Use results to remove constraints | Use results to discipline workers |
Direct work percentage is a measure of how well the system supports the crew, not of how hard people work. Research has found that it is only loosely related to output, because some supporting work is essential and because direct work done on the wrong thing, or done badly, adds no value. Its main use is to show the size and type of non-direct time, which points to constraints such as poor material logistics or unreliable hand-offs.
Foreman delay surveys
A foreman delay survey asks each foreperson, at the end of the day or week, to estimate the crew hours lost to specific causes: waiting for materials, waiting for information, waiting for equipment, rework, interference from other trades, moving between areas, and so on. Developed in the 1980s, the method is cheap, quick and gives forepersons a voice. Its weakness is that it relies on memory and judgement, and forepersons may under-report delays caused by their own crews. Used regularly and without blame, it gives a useful picture of the main causes of lost time and complements the reasons for non-completion recorded in the Last Planner System.
# Foreman delay survey: crew hours lost by cause, two weeks on Willowmere (illustrative)
reports = {  # trade: {cause: hours lost}
    "drywall":    {"waiting for hoist": 26, "area not ready": 34, "material not on floor": 18, "rework": 12},
    "electrical": {"waiting for information": 22, "area not ready": 16, "material not on floor": 9, "rework": 14},
    "mechanical": {"waiting for information": 18, "interference": 15, "waiting for hoist": 12, "rework": 6},
    "plumbing":   {"area not ready": 11, "material not on floor": 13, "interference": 7, "rework": 9},
}
crew_hours = {"drywall": 960, "electrical": 720, "mechanical": 800, "plumbing": 560}
from collections import Counter
by_cause = Counter()
for trade, d in reports.items():
    lost = sum(d.values())
    print(f"{trade:<11} lost {lost:>3} of {crew_hours[trade]} h ({lost / crew_hours[trade]:.1%})")
    by_cause.update(d)
print("By cause:", ", ".join(f"{c} {h}" for c, h in by_cause.most_common()))drywall lost 90 of 960 h (9.4%) electrical lost 61 of 720 h (8.5%) mechanical lost 51 of 800 h (6.4%) plumbing lost 40 of 560 h (7.1%) By cause: area not ready 61, rework 41, material not on floor 40, waiting for information 40, waiting for hoist 38, interference 22
Crew balance charts
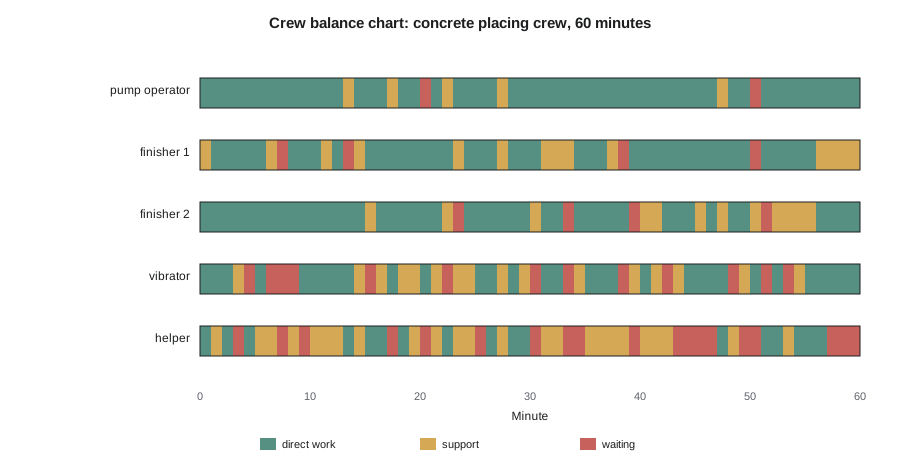
A crew balance chart shows what each member of a crew is doing over a period of time, usually by observing the crew continuously for an hour or so and recording each person's activity minute by minute. Plotted as parallel bars, it shows whether crew members are evenly loaded, whether some are waiting on others and whether the crew is the right size and mix for the task. It is especially useful for crews that work together closely, such as concrete placing, curtain wall installation or crane-dependent work.
# Crew balance from minute-by-minute observation of a 5-person placing crew (60 minutes, seeded)
import random
rng = random.Random(7)
roles = {"pump operator": (0.80, 0.15, 0.05), "finisher 1": (0.70, 0.20, 0.10), "finisher 2": (0.68, 0.20, 0.12),
         "vibrator": (0.62, 0.23, 0.15), "helper": (0.38, 0.24, 0.38)}
for role, (d, s, w) in roles.items():
    mins = rng.choices(["D", "S", "W"], weights=[d, s, w], k=60)
print(f"{role:<14}{''.join(mins)} direct {mins.count('D'):>2} support {mins.count('S'):>2} wait {mins.count('W'):>2}")pump operator DDDDDDDDDDDDDSDDDSDDWDSDDDDSDDDDDDDDDDDDDDDDDDDSDDWDDDDDDDDD direct 53 support 5 wait 2 finisher 1 SDDDDDSWDDDSDWSDDDDDDDDSDDDSDDDSSSDDDSWDDDDDDDDDDDWDDDDDSSSS direct 42 support 14 wait 4 finisher 2 DDDDDDDDDDDDDDDSDDDDDDSWDDDDDDSDDWDDDDDWSSDDDSDSDDSWSSSSDDDD direct 44 support 12 wait 4 vibrator DDDSWDWWWDDDDDSWSDSSDSWSSDDSDSWDDWSDDDWSDSWSDDDDWSDWDWSDDDDD direct 31 support 16 wait 13 helper DSDWDSSWSWSSSDSDDWDSWSDSSWDSDDWSSWWSSSSWSSSWWWWDSWWDDSDDDWWW direct 17 support 24 wait 19
The helper's frequent waiting, while other crew members are busy, suggests that the crew could be reorganized: the helper might take on preparation of the next pour area during truck changes, or the crew could be reduced by one on smaller pours. Crew balance analysis should involve the crew itself, which often knows exactly why the waiting happens.
Learning curves on repetitive work
On repetitive work, crews get faster as they repeat the same task, because they learn the layout, develop routines and solve problems once rather than repeatedly. The classic learning curve, also used in ACCT-222 for cost estimation, says that each time cumulative output doubles, the average time per unit falls to a fixed fraction of its previous value, called the learning rate. An 85 % learning curve means that by the time the second floor is complete, the average time per floor is 85 % of the first floor's time.
# Cumulative-average learning curve for drywall on Willowmere floors 2..8 (85 % rate)
import math
T1 = 620                 # worker-hours for the first typical floor
rate = 0.85
b = math.log(rate) / math.log(2)
prev_total = 0
for n in range(1, 8):
    avg = T1 * n ** b               # cumulative average hours per floor
    total = avg * n
    unit = total - prev_total       # hours for the nth floor itself
    prev_total = total
    print(f"floor {n + 1}: cumulative average {avg:6.1f} h, this floor {unit:6.1f} h")
print(f"Total for 7 floors: {prev_total:,.0f} h versus {T1 * 7:,} h with no learning")floor 2: cumulative average 620.0 h, this floor 620.0 h floor 3: cumulative average 527.0 h, this floor 434.0 h floor 4: cumulative average 479.2 h, this floor 383.6 h floor 5: cumulative average 447.9 h, this floor 354.2 h floor 6: cumulative average 425.1 h, this floor 333.8 h floor 7: cumulative average 407.3 h, this floor 318.4 h floor 8: cumulative average 392.9 h, this floor 306.1 h Total for 7 floors: 2,750 h versus 4,340 h with no learning
Learning matters for planning in two ways. First, early floors will take longer than later ones, so a takt plan should allow for a slower start or accept that early zones will be the hardest to hold. Second, learning is lost when crews change, so keeping the same crew members on repeated work, which takt planning encourages, protects the gain. A first-run study, covered in lesson 11, accelerates learning by planning and reviewing the first instance of a repeated task in detail.
Technology for measurement
Cameras, wearable sensors and computer vision, discussed in CON-260 lesson 10, can now estimate crew activity, track material movement and measure installed quantities automatically. They can collect far more data than a human observer. They also raise privacy concerns, union and employment law questions and the risk that workers see measurement as surveillance. Any use of such tools should be transparent, limited to clear purposes, compliant with privacy law and agreed with workers and their representatives, and it should focus on finding and fixing system problems rather than monitoring individuals.
Common mistakes
MistakeJudging crew productivity from the cost report alone.
InsteadAdd activity and cause measures to see why performance differs from budget.
MistakeDrawing conclusions from a few dozen work-sampling observations.
InsteadCollect enough observations for the precision needed, typically several hundred or more.
MistakeReporting work-sampling results on named workers.
InsteadReport by crew and category, and use results to remove constraints.
MistakeTreating direct-work percentage as a measure of effort.
InsteadTreat it as a measure of how well the system supports the crew.
MistakeMoving crews between tasks on repetitive work.
InsteadKeep crews on repeated work to retain learning.
Summary and key terms
- Output, activity and cause measures answer different questions; a good program uses all three.
- The performance factor is earned hours divided by actual hours, and depends on the quality of the budget.
- Work sampling estimates time use from many random instantaneous observations; sample size follows from the binomial approximation.
- Work sampling must be random, transparent and reported by crew and category, not individual.
- Foreman delay surveys collect forepersons' estimates of hours lost by cause.
- Crew balance charts show how evenly crew members are loaded.
- Learning curves describe faster performance on repeated work; keeping crews stable protects learning.
- Performance factor
- Earned hours divided by actual hours for completed work.
- Earned hours
- The budgeted hours for the quantity of work actually completed.
- Productivity index
- A ratio comparing actual productivity with a baseline or budget.
- Work sampling
- Estimating time use from random instantaneous observations.
- Direct work rate
- The share of observations in which workers are directly adding to the product.
- Foreman delay survey
- A questionnaire in which forepersons estimate crew hours lost to specific causes.
- Crew balance chart
- A chart showing each crew member's activity over time.
- Learning curve
- A model in which time per unit falls by a fixed rate as cumulative output doubles.
- Learning rate
- The fraction to which average time per unit falls with each doubling of output.
- Benchmark
- A reference value for productivity from earlier projects or industry data.
Practice problems
Work each problem on paper first, then reveal the answer to check.
A crew earned 300 hours and charged 375. What is the performance factor?
Show answer
300 ÷ 375 = 0.80.
How many observations estimate a 30 % category within ±4 points at 95 % confidence?
Show answer
1.96² × 0.3 × 0.7 ÷ 0.04² ≈ 505.
In a study of 900 observations, 135 are waiting. What is the 95 % confidence interval?
Show answer
15 % ± 1.96 × √(0.15 × 0.85 ÷ 900) ≈ 15 % ± 2.3 points.
Why must work-sampling times be random?
Show answer
So observations are representative and not biased by routine.
Give one weakness of foreman delay surveys.
Show answer
They rely on memory and may under-report delays caused by the crew itself.
What does a crew balance chart show?
Show answer
How each crew member's time divides between direct work, support and waiting.
With an 80 % learning curve and 100 hours for unit 1, what is the cumulative average after 4 units?
Show answer
100 × 0.8 × 0.8 = 64 hours.
Why is direct work percentage not a measure of effort?
Show answer
Most non-direct time is caused by the system, such as waiting and material handling.
Why keep the same crew on repeated floors?
Show answer
To retain the learning gained on earlier floors.
What should accompany technology-based measurement of workers?
Show answer
Transparency, clear purpose, privacy compliance and agreement with workers.
Lesson quiz · 5 questions
Score 60% or more to complete this lesson.
Create a free account to save your progress, take quizzes and earn a certificate.