
BIOL-208 · Lesson 9 of 12 · 24 min
Mutualism and community structure
Not every interaction between species is a contest. In a mutualism, both partners gain. Most land plants depend on fungi in their roots, most flowering plants on animals that carry their pollen, and reef corals on algae living inside their cells. Mutualisms are as fundamental to ecosystems as predation and competition, though they were studied less for most of the twentieth century. This lesson first examines mutualism and facilitation, then turns to the community level: how ecologists describe which species are present and how common they are, how to compare communities, how food webs are structured, and how certain species, such as sea otters and wolves, exert effects on their communities far out of proportion to their abundance.
Mutualism
Mutualisms vary in how tightly the partners depend on each other. In obligate mutualisms, neither partner can survive without the other: lichens are partnerships between a fungus and an alga or cyanobacterium, and the yucca and the yucca moth of the southwestern deserts depend entirely on each other, the moth pollinating the flower and laying its eggs in the ovary where some seeds feed its larvae. In facultative mutualisms, partners benefit but can survive alone, as with many pollinators and the plants they visit.
| Mutualism | Partners | What each gains |
|---|---|---|
| Mycorrhizae | Plant roots and fungi | Fungus gets sugars; plant gets phosphorus, nitrogen and water |
| Nitrogen fixation | Legumes, alder and bacteria (Rhizobium, Frankia) | Bacteria get sugars; plant gets fixed nitrogen |
| Pollination | Flowering plants and insects, birds, bats | Animal gets nectar or pollen; plant gets pollen moved |
| Seed dispersal | Fruiting plants and birds, mammals, ants | Animal gets food; plant gets seeds carried away |
| Lichen | Fungus and alga or cyanobacterium | Fungus gets sugars; alga gets shelter and water |
| Gut symbionts | Ruminants and microbes | Microbes get food and shelter; ruminant digests cellulose |
| Protection | Ants and acacias; ants and aphids | Ants get food or housing; partner gets defence |
Mycorrhizal fungi are perhaps the most important mutualists on land. More than 80 per cent of plant species form them. In ectomycorrhizae, typical of pines, spruces, birches and oaks, the fungus wraps the root tips in a sheath and grows between the root cells; in arbuscular mycorrhizae, typical of grasses and most herbs, the fungus grows into the root cells. The fungal threads (hyphae) extend far into the soil, absorbing phosphorus and water from a much larger volume than roots alone could reach. Research led by Suzanne Simard at the University of British Columbia showed that carbon can move between trees through shared fungal networks, though how much this matters for forest communities, and claims that trees deliberately share resources, are actively debated.
Mutualisms are not pure cooperation. Each partner is selected to gain as much as possible at the least cost, so cheaters arise: some orchids attract pollinators with the promise of nectar but offer none, and some yucca moths lay so many eggs that larvae eat most of the seeds. Plants can sanction cheaters, for example by aborting flowers with too many moth eggs or cutting oxygen supply to root nodules whose bacteria fix little nitrogen.
Facilitation
A related interaction is facilitation, in which one species makes the environment more suitable for another, often without itself benefiting. In harsh environments, nurse plants shelter seedlings from wind, heat and grazers: young saguaro cacti in the Sonoran Desert survive mainly in the shade of palo verde trees. The stress-gradient hypothesis proposes that facilitation becomes more important, and competition less, as environmental stress increases, a pattern seen in alpine and salt-marsh plants. Facilitation also drives succession, as lesson 10 shows.
Describing communities
A community is all the interacting species in an area. The simplest description is species richness: the number of species present. But richness ignores how common each species is. Two forests may each contain ten tree species, but one may be 91 per cent sugar maple while the other has all ten species in similar numbers. Evenness measures how equally individuals are spread among species, and diversity indices combine richness and evenness. BIOL-108 introduced the Shannon index (\( H' \)) and Simpson's index. This lesson adds three tools that ecologists use constantly: rank-abundance curves, rarefaction and beta diversity.
A rank-abundance curve plots species from most to least abundant, with abundance on a log scale. Communities with high evenness have flat curves; communities dominated by a few species have steep ones. Most communities have a few common species and many rare ones.
Species richness depends heavily on sampling effort: the more individuals you count, the more species you find, because rare species turn up only in large samples. Comparing richness between sites sampled with different effort is therefore misleading. Rarefaction solves this by repeatedly drawing random subsamples of a fixed size from each sample and calculating the expected number of species, so sites can be compared at the same sample size.
import numpy as np

rng = np.random.default_rng(208)
# Invented bird counts from two forest sites (individuals per species)
site_a = np.array([60, 41, 30, 22, 15, 11, 8, 6, 4, 3, 2, 2, 1, 1, 1, 1])
site_b = np.array([25, 18, 14, 9, 6, 4, 3, 2, 1, 1, 1])

def rarefy(counts, n, reps=2000):
    pool = np.repeat(np.arange(counts.size), counts)
    return np.mean([np.unique(rng.choice(pool, n, replace=False)).size for _ in range(reps)])

def shannon(c):
    p = c / c.sum(); return -(p * np.log(p)).sum()

for name, c in [("A", site_a), ("B", site_b)]:
    print(f"site {name}: {c.sum()} birds, {c.size} species observed, Shannon H' = {shannon(c):.2f}")
for n in (20, 50, 84):
print(f"expected species in {n:3d} birds: A = {rarefy(site_a, n):5.2f} B = {rarefy(site_b, n):5.2f}")site A: 208 birds, 16 species observed, Shannon H' = 2.10 site B: 84 birds, 11 species observed, Shannon H' = 1.93 expected species in 20 birds: A = 7.73 B = 7.07 expected species in 50 birds: A = 10.64 B = 9.54 expected species in 84 birds: A = 12.52 B = 11.00
Site A has 16 species to site B's 11, but it was sampled far more heavily. Rarefied to the same 84 birds, the gap shrinks considerably. Whether the remaining difference is real would need replicate samples and a statistical test.
Comparing communities: beta diversity
Robert Whittaker distinguished diversity within a site (alpha diversity), across a whole region (gamma diversity), and the change in species composition between sites (beta diversity). High beta diversity means sites have very different species, as along a gradient from valley bottom to mountain top. Two simple similarity indices use presence and absence: the Jaccard index is the number of shared species divided by the total number of species found at either site, and the Sørensen index gives shared species double weight.
Here \( a \) and \( b \) are the numbers of species at each site and \( c \) the number shared.
sites = {
    "valley":  {"sugar maple", "red oak", "basswood", "white pine", "beech", "hemlock", "ironwood"},
    "slope":   {"sugar maple", "red oak", "white pine", "hemlock", "red maple", "white birch"},
    "ridge":   {"red pine", "white pine", "red oak", "jack pine", "blueberry", "white birch"},
}
names = list(sites)
for i in range(len(names)):
    for j in range(i + 1, len(names)):
        A, B = sites[names[i]], sites[names[j]]
        c = len(A & B)
        jac = c / len(A | B); sor = 2 * c / (len(A) + len(B))
        print(f"{names[i]:6s} vs {names[j]:6s}: shared {c}, Jaccard {jac:.2f}, Sorensen {sor:.2f}")
gamma = len(set().union(*sites.values()))
alpha = sum(len(s) for s in sites.values()) / len(sites)
print(f"gamma = {gamma}, mean alpha = {alpha:.2f}, Whittaker beta = gamma/alpha = {gamma/alpha:.2f}")valley vs slope : shared 4, Jaccard 0.44, Sorensen 0.62 valley vs ridge : shared 2, Jaccard 0.18, Sorensen 0.31 slope vs ridge : shared 3, Jaccard 0.33, Sorensen 0.50 gamma = 12, mean alpha = 6.33, Whittaker beta = gamma/alpha = 1.89
Food webs
A food web maps who eats whom in a community. Organisms are grouped into trophic levels: primary producers (plants, algae), primary consumers (herbivores), secondary consumers (predators of herbivores) and so on, with decomposers processing dead material from every level. Real food webs are tangled, because many species eat at several levels (omnivory) and some, like the young of large fish, change diet as they grow. Ecologists describe food webs with simple statistics. Connectance is the fraction of all possible feeding links that actually occur; for \( S \) species and \( L \) links it is \( L/S^2 \). Most real food webs have connectance between about 0.05 and 0.3, and food chains are short, rarely more than four or five links, partly because energy is lost at each step, as lesson 11 explains.
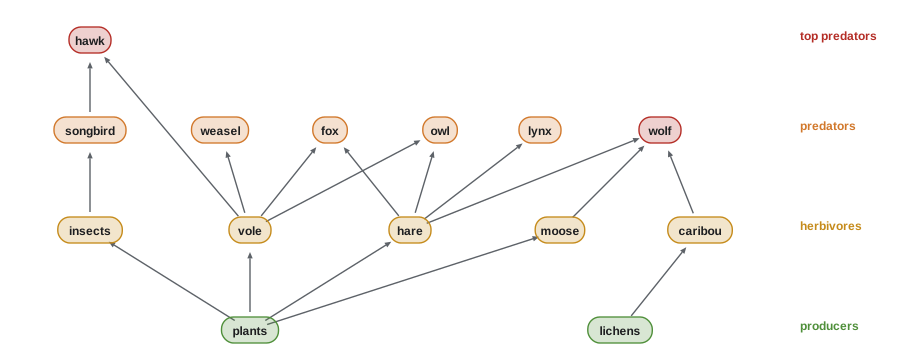
links = {
    "hare": ["plants"], "moose": ["plants"], "caribou": ["lichens"], "vole": ["plants"],
    "insects": ["plants"], "lynx": ["hare"], "fox": ["hare", "vole"],
    "owl": ["hare", "vole"], "weasel": ["vole"], "wolf": ["moose", "caribou", "hare"],
    "songbird": ["insects"], "hawk": ["songbird", "vole"],
}
species = set(links) | {p for v in links.values() for p in v}
S = len(species); L = sum(len(v) for v in links.values())
print(f"species S = {S}, feeding links L = {L}, connectance L/S^2 = {L / S**2:.3f}, links per species = {L / S:.2f}")
basal = sorted(species - set(links))
print("basal species:", basal)species S = 14, feeding links L = 17, connectance L/S^2 = 0.087, links per species = 1.21 basal species: ['lichens', 'plants']
Keystone species and trophic cascades
In 1966, Robert Paine reported an experiment on the rocky shores of Washington state. He removed the predatory sea star Pisaster ochraceus from a stretch of shore and left a nearby stretch untouched. Without the sea star, mussels spread and crowded out most other species; within a few years, the number of species dropped from 15 to 8. Paine called Pisaster a keystone species: one whose effect on its community is large relative to its abundance, like the keystone at the top of an arch that holds the other stones in place. Since 2013, sea star wasting disease has killed vast numbers of sea stars along the Pacific coast from Alaska to Mexico, including Pisaster and the sunflower star, allowing sea urchins to multiply in places.
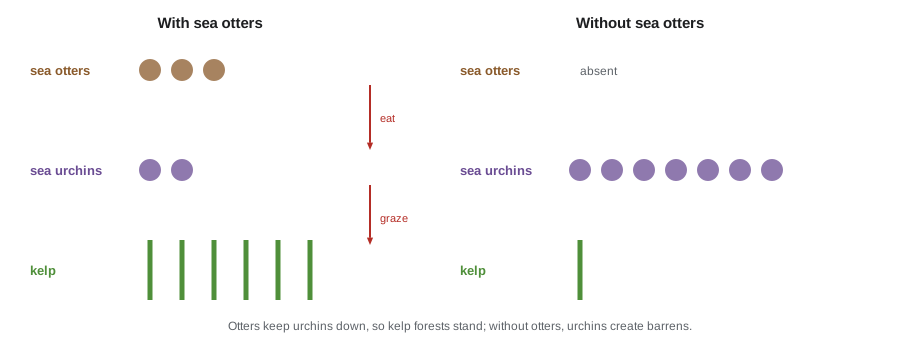
Sea otters are another keystone predator. Hunted almost to extinction for their fur by the early twentieth century, they were reintroduced to the west coast of Vancouver Island between 1969 and 1972 using animals from Alaska. Where otters returned, they ate sea urchins, urchin numbers fell, and kelp forests regrew, providing habitat for fish and absorbing carbon. Where otters were absent, urchins grazed kelp down to barren rock. This chain of effects running from a top predator down through herbivores to plants is a trophic cascade. The return of otters brought conflict as well as benefits: they also eat the clams, crabs and urchins harvested by coastal First Nations and commercial fishers, and Indigenous communities have called for a role in managing otters.
The reintroduction of grey wolves to Yellowstone National Park in 1995 and 1996 is often presented as a textbook trophic cascade: wolves reduced elk numbers and made elk avoid risky areas, allowing willow and aspen to regrow along streams, which in turn benefited beavers and songbirds. The story is more contested than popular accounts suggest. Elk declined for several reasons, including hunting by people, bears and cougars and drought, and studies disagree on how much willow and aspen have recovered and how much of it is due to wolves. Some researchers argue that the cascade is weaker or more local than first claimed, and that hydrology changed after beavers and wolves were lost for decades. The debate illustrates how hard it is to establish cause in large, unreplicated natural experiments.
Not every important species is a predator. Foundation species, such as eelgrass, reef-building corals, kelp and dominant trees, create the physical structure of a community. Ecosystem engineers modify habitat physically: beavers turn streams into ponds and wetlands, changing water flow, nutrient cycling and the species present for decades.
Common mistakes
MistakeMutualism means the partners cooperate unselfishly.
InsteadEach partner is selected to gain the most at least cost; cheaters arise and are often sanctioned.
MistakeThe site with more species observed is the more diverse.
InsteadRichness depends on sampling effort; rarefaction compares sites at equal sample sizes.
MistakeA keystone species must be the most abundant species.
InsteadA keystone has an effect far out of proportion to its abundance.
MistakeThe Yellowstone wolf cascade is settled fact.
InsteadIts strength and causes are debated; elk declined for several reasons and vegetation recovery varies.
MistakeFood chains are long because there are many species.
InsteadFood chains are usually short, partly because energy is lost at each trophic step.
Summary and key terms
- Mutualisms benefit both partners; mycorrhizae, nitrogen fixation, pollination and seed dispersal are widespread.
- Mutualisms involve conflicts of interest and cheating; facilitation becomes more important in stressful environments.
- Communities are described by richness, evenness and diversity indices; rank-abundance curves show dominance.
- Rarefaction compares richness at equal sample sizes; Jaccard and Sørensen indices measure similarity; beta diversity measures turnover.
- Food webs have short chains and connectance typically between 0.05 and 0.3.
- Keystone species such as Pisaster and sea otters have large effects relative to abundance, driving trophic cascades.
- Foundation species and ecosystem engineers such as kelp and beavers create habitat for others.
- mutualism
- An interaction in which both species benefit.
- mycorrhiza
- A mutualism between plant roots and fungi.
- facilitation
- An interaction in which one species makes conditions better for another.
- species richness
- The number of species in a community.
- evenness
- How equally individuals are distributed among species.
- rarefaction
- Estimating expected species richness at a standard sample size by resampling.
- beta diversity
- The change in species composition between sites.
- connectance
- The fraction of possible feeding links that actually occur in a food web.
- keystone species
- A species whose effect on its community is large relative to its abundance.
- trophic cascade
- Effects of a top predator that pass down through herbivores to plants.
Practice problems
Work each problem on paper first, then reveal the answer to check.
Give an example of an obligate mutualism.
Show answer
Lichen fungus and alga, or yucca and yucca moth.
What do plants gain from mycorrhizal fungi?
Show answer
Phosphorus, nitrogen and water from a larger soil volume.
State the stress-gradient hypothesis.
Show answer
Facilitation becomes more important and competition less as environmental stress increases.
Why can't you compare raw species counts from sites sampled with different effort?
Show answer
More effort finds more rare species, so richness rises with sample size.
Site X has 12 species, site Y 10, sharing 6. Calculate Jaccard and Sørensen.
Show answer
Jaccard = 6/(12 + 10 − 6) = 0.375. Sørensen = 12/22 ≈ 0.545.
A food web has 20 species and 60 links. What is its connectance?
Show answer
60/400 = 0.15.
What happened when Paine removed Pisaster?
Show answer
Mussels took over and species richness fell from 15 to 8.
Describe the sea otter trophic cascade.
Show answer
Otters eat urchins, urchin numbers fall, and kelp forests recover.
Why is the Yellowstone wolf cascade debated?
Show answer
Elk declined for several reasons and vegetation recovery is variable; causes are hard to separate.
How is a beaver an ecosystem engineer?
Show answer
Its dams create ponds and wetlands that change water flow, nutrients and species.
Lesson quiz · 5 questions
Score 60% or more to complete this lesson.
Create a free account to save your progress, take quizzes and earn a certificate.