
AUTO-330 · Lesson 4 of 12 · 22 min
Graphing data and finding the fault in a data stream
Ines Moreau's 2019 hybrid comes back to Ridgeline with a complaint that is hard to describe. Once or twice a day, usually after the car has been driving for a while, it gives a short stumble, "like a hiccup", just as the gasoline engine is running and the car is pulling gently. There are no codes. The hybrid system starts and stops the engine automatically, so Ines cannot always tell whether the engine is running when it happens. "A snapshot won't find this," Marty says. "You need a movie. Record everything, graph it, and let the data show you the moment it goes wrong."
This lesson is about turning scan data into evidence: choosing what to record, setting up recordings and triggers, reading graphs, using statistics to find values that do not belong, comparing parameters that should move together, and recognizing the patterns of the most common faults. Ines's hiccup is the case.
Why graphs beat numbers
A list of numbers on a scan tool updates a few times a second. The human eye cannot follow more than two or three of them at once, and a value that jumps for a fraction of a second is easy to miss. A graph shows the history of each value, so a sudden change, a slow drift, a value that stops moving or two values that should move together but do not are all obvious at a glance. Most professional scan tools can graph several parameters at once, record them to a file and play them back. The recording can be exported as a spreadsheet file, a comma-separated list of time and values, which a technician can open on a computer and analyse properly.
Every scan tool has a limit on how fast it can read data. Over the diagnostic connector, each parameter takes time to request and receive, so the more parameters a recording includes, the fewer updates each one gets. A recording of forty parameters may update each only two or three times per second; a recording of six may update each ten or more times per second. A short glitch can fall between samples and be missed entirely. For intermittent faults, Kiran records a small, carefully chosen list rather than everything.
Choosing what to record
The choice comes from the theory. For a stumble, the parameters worth recording are those that would change if the engine's fuel, air or spark were disturbed, plus those that tell the module what is happening: engine speed, throttle and pedal position, mass airflow or manifold pressure, short-term fuel trims, spark advance and knock retard, coolant and intake air temperature, misfire counts if available, and the hybrid system's engine request and torque command. Kiran also adds the ignition voltage, because a voltage dip can reset or confuse modules. That is twelve parameters, which this scan tool can record at about four samples per second each.
Recordings also need a trigger, the event that tells the tool to keep the data. A scan tool's recording runs in a loop, and when the trigger happens, it saves a set time before and after it. The trigger can be a button press by the driver, a code setting, or a parameter crossing a threshold. For Ines's car, Kiran sets two: a button on the tool that Ines can press when she feels the hiccup, and an automatic trigger if the short-term fuel trim jumps by more than 8 percent in less than a second.
Reading a graph
When reading a recorded graph, Kiran looks first at the time of the event and then at each parameter in turn, asking three questions: did it change at the moment of the event, did it change before or after the others, and is its value believable for the conditions. Cause comes before effect. If the fuel trim swings after a temperature reading jumps, the temperature reading is the more likely cause; if the temperature jumps after the stumble, it may be a result.
Ines brings the car back two days later with three saved recordings. In each one, at the moment of the hiccup, the coolant temperature parameter drops from about 87 °C (189 °F) to −40 °C (−40 °F) for one sample, then returns. The short-term fuel trim swings negative right after, and the engine speed wobbles. Nothing else changes first. A coolant temperature of minus forty is the reading a module typically shows when the sensor circuit is open, because an open circuit looks like an extremely cold sensor. The engine is not cold; the signal is dropping out.
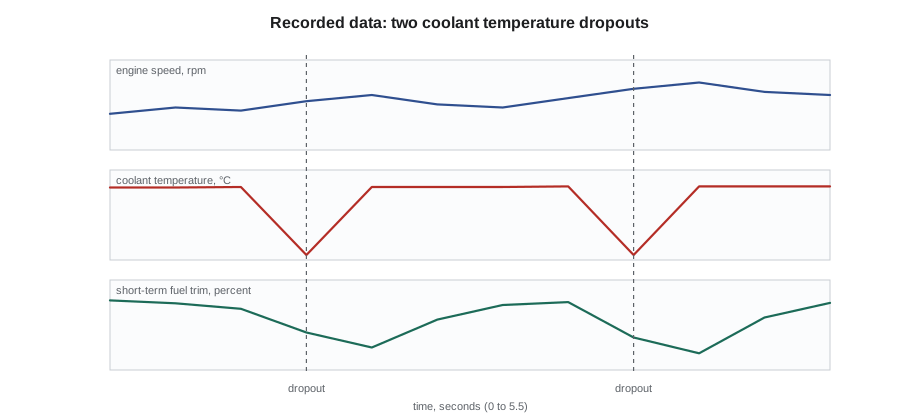
The module is reacting exactly as it should to the reading it receives. When the coolant temperature suddenly reads extremely cold, the fuel and spark calculations change for that moment, and on a hybrid the engine and motor torque split may change too, which the driver feels as a hiccup. The fault is in the signal, not the engine.
Statistics: finding values that do not belong
A recording of a long drive may contain thousands of samples, and a glitch can hide among them. Kiran exports the recordings and runs a short program that reads the file and reports each parameter's minimum, maximum and average, then flags samples that are outside a believable range or that change faster than the real quantity could. A coolant temperature cannot really change by 120 °C (216 °F) in half a second; a jump like that is an electrical fault.
# Read a recorded data file, report each parameter, and flag impossible values and jumps
import csv, io
data = """t,rpm,ect,tps,stft
0.0,1450,86,12.0,1.5
0.5,1460,86,12.2,0.8
1.0,1455,87,12.1,-0.5
1.5,1470,-40,12.3,-6.2
2.0,1480,87,12.4,-9.8
2.5,1465,87,12.2,-3.1
3.0,1460,87,12.0,0.4
3.5,1475,88,12.1,1.1
4.0,1490,-40,12.6,-7.4
4.5,1500,88,12.8,-11.2
5.0,1485,88,12.5,-2.6
5.5,1480,88,12.4,0.9"""
rows = list(csv.DictReader(io.StringIO(data)))
limits = {"ect": (-30, 130), "rpm": (500, 6500), "tps": (0, 100), "stft": (-25, 25)}
max_step = {"ect": 5, "rpm": 1500, "tps": 60, "stft": 20}
for name in ("rpm", "ect", "tps", "stft"):
    vals = [float(r[name]) for r in rows]
    print(f"{name:>5}: min {min(vals):8.1f}  max {max(vals):8.1f}  average {sum(vals) / len(vals):8.1f}")
for prev, row in zip(rows, rows[1:]):
    for name, (lo, hi) in limits.items():
        v, p = float(row[name]), float(prev[name])
        if not lo <= v <= hi or abs(v - p) > max_step[name]:
print(f"t = {row['t']} s: {name} = {v} (previous {p}) is outside its range or jumped too far")rpm: min 1450.0 max 1500.0 average 1472.5 ect: min -40.0 max 88.0 average 66.0 tps: min 12.0 max 12.8 average 12.3 stft: min -11.2 max 1.5 average -3.0 t = 1.5 s: ect = -40.0 (previous 87.0) is outside its range or jumped too far t = 2.0 s: ect = 87.0 (previous -40.0) is outside its range or jumped too far t = 4.0 s: ect = -40.0 (previous 88.0) is outside its range or jumped too far t = 4.5 s: ect = 88.0 (previous -40.0) is outside its range or jumped too far
In this short extract, two dropouts among twelve samples drag the average coolant temperature down noticeably, but in a real recording of several thousand samples the same two dropouts would move the average by a fraction of a degree, and the average alone would hide them. The minimum and the step check find them however long the recording is. The same kind of check also finds a sensor that is stuck, whose maximum and minimum are the same over a drive in which the real value should change, and a sensor that is noisy, whose value changes by a small amount every sample when it should be steady.
Kiran adds one more check that the program does not show: whether each flagged sample is followed by a change in the parameters the module calculates from it. Here, every dropout is followed by a negative fuel trim swing within one sample. That timing, cause then effect, is what makes her confident.
Parameters that should move together
Many faults show up as a pair of parameters that normally move together and suddenly do not. Throttle position and mass airflow should rise together when the throttle opens. Engine speed and vehicle speed should keep a fixed ratio in each gear. The two pedal position tracks should always agree. Upstream oxygen sensor readings should respond to fuel trim changes within a fraction of a second. When one partner moves and the other does not, or moves late, the fault is between them.
To compare two parameters, Kiran uses correlation, a number between minus one and one that measures how closely they move together, and lag, how far one trails the other. She tests the method on the throttle and airflow recorded during a snap of the throttle on Ines's car. On a healthy engine, airflow rises a fraction of a second after the throttle opens, as the intake fills; a much longer lag would point at a slow airflow sensor or a restricted intake.
# Correlation and lag between throttle position and mass airflow during a throttle snap (10 samples per second)
tps = [12, 12, 13, 35, 62, 75, 76, 76, 75, 60, 30, 14, 12, 12, 12]
maf = [5.1, 5.0, 5.2, 5.6, 14.8, 28.4, 34.0, 35.1, 35.3, 34.6, 26.1, 12.2, 6.0, 5.2, 5.1]
def corr(a, b):
    n = len(a); ma, mb = sum(a) / n, sum(b) / n
    cov = sum((x - ma) * (y - mb) for x, y in zip(a, b))
    va = sum((x - ma) ** 2 for x in a) ** 0.5; vb = sum((y - mb) ** 2 for y in b) ** 0.5
    return cov / (va * vb)
best = max(range(0, 4), key=lambda k: corr(tps[:len(tps) - k], maf[k:]))
print(f"correlation with no shift: {corr(tps, maf):.2f}")
for k in range(0, 4):
    print(f"airflow shifted {k * 100:3} ms earlier: correlation {corr(tps[:len(tps) - k], maf[k:]):.2f}")
print(f"airflow follows the throttle by about {best * 100} ms")correlation with no shift: 0.88 airflow shifted 0 ms earlier: correlation 0.88 airflow shifted 100 ms earlier: correlation 1.00 airflow shifted 200 ms earlier: correlation 0.85 airflow shifted 300 ms earlier: correlation 0.45 airflow follows the throttle by about 100 ms
The correlation is highest when the airflow is shifted one sample, a tenth of a second, which is a normal lag for an intake filling after a throttle snap. The airflow sensor and the throttle on Ines's car are working together correctly. The method works the same way for any pair: pedal tracks, cam desired and actual, fuel pressure desired and actual, or engine speed and wheel speed.
Common data patterns
With experience, a technician recognizes common fault patterns in graphs. A sensor signal that drops to an extreme value for a sample or two, as on Ines's car, is an intermittent open or a poor connection. A signal that drops to zero is often a short to ground or a lost reference voltage, and if several sensors sharing a five-volt reference drop together, the reference is the fault, as Kiran found on Gord Haney's pickup in the electrical course. A slow, steady drift is usually a sensor or a mechanical change, such as a thermostat opening early. A value that does not move when it should is a stuck sensor, a lost signal that the module has replaced with a default, or an actuator that is not responding.
| Pattern in the graph | Usual meaning | Next test |
|---|---|---|
| One-sample drop to an extreme value | Intermittent open or poor connection | Wiggle test with the graph running; check terminal fit |
| Several sensors drop together | Shared reference or ground fault | Measure the reference and ground at a sensor |
| Slow drift away from expected | Sensor ageing or a mechanical change | Compare with an independent measurement |
| Value frozen while conditions change | Stuck sensor or default value | Check for a code; back-probe the signal |
| Two partners stop moving together | Fault between them in the system | Test each partner independently |
Finding the fault in the wiring
A one-sample dropout means the circuit is opening for a few milliseconds at a time. Kiran sets the scan tool to graph only the coolant temperature, which raises its update rate to about twenty samples per second, and then gently moves the sensor's connector and harness while watching the graph. Nothing happens when she moves the harness. When she presses the connector body sideways, the reading drops to minus forty and recovers. She disconnects the connector and inspects it with a magnifier. The sensor's terminals are lightly polished on one side and dark brown on the other, the look of fretting corrosion.
Fretting happens when a connection moves microscopically with vibration and heat cycles. Each movement scrapes away a little of the tin plating, and the exposed metal oxidizes. Over time, the oxide builds up until the connection opens briefly under vibration. On Ines's car the connector sits on the engine, which shakes each time the hybrid system starts and stops it, many more times a day than a conventional engine. The fault appeared once or twice a day because the connection opened only when the vibration and the engine temperature were just right.
The repair, from the manufacturer's service information, is to replace the connector's female terminals with new ones of the correct type and to apply the dielectric grease the manufacturer specifies, then check the terminal fit with the correct test probe. A pin that slides in with no drag is loose and must be replaced. Kiran also checks the mating sensor pins and replaces the sensor, because its pins are worn too. Before and after the repair she measures the circuit's voltage drop with the sensor warm, and records it on the order.
Verifying with data
The same recording that found the fault verifies the repair. Kiran drives Ines's car for an hour on the route where the hiccup usually happened, with the coolant temperature graphed at the high update rate and the same automatic trigger set. The trigger never fires, the graph shows no dropouts, and the fuel trims stay smooth. She also asks Ines to drive for a week with the tool's recorder left connected. The recorder shows no dropouts in 31 engine starts. The three Cs record the before and after recordings by file name, so they can be found later.
Marty uses the job to make a point to the newer apprentices. A part-swapping approach would probably have replaced the coolant sensor and fixed the problem for a while, because the new sensor's pins would grip the old terminals more tightly at first. The hiccup would have returned in a few months, and the customer would have paid twice. The data showed that the connection, not the sensor, was the fault.
Worked problem
How fast must a recording sample to catch a glitch?
A dropout lasts about 30 milliseconds. A recording of 12 parameters updates each at 4 samples per second; a recording of 1 parameter updates at 20 samples per second. What chance does each recording have of catching one dropout?
Show solution
- At 4 samples per second, samples are 250 ms apart; a 30 ms dropout is caught only if a sample happens to fall inside it: about 30 ÷ 250 = 12 percent of the time.
- At 20 samples per second, samples are 50 ms apart: about 30 ÷ 50 = 60 percent.
- Over many dropouts, both will catch some, but the faster recording catches most of them.
Answer: About 12 percent per dropout at 4 samples per second and 60 percent at 20; record fewer parameters, or use a lab scope, for short glitches.
Common mistakes
MistakeRecording every parameter available.
InsteadChoose a short list from your theory so each parameter updates often.
MistakeLooking only at averages.
InsteadCheck minimums, maximums and step changes; glitches hide in averages.
MistakeBlaming the parameter that changed most.
InsteadFind which change came first; cause comes before effect.
MistakeReplacing a sensor for a signal dropout.
InsteadTest the connection; fretting terminals cause most dropouts.
MistakeVerifying a repair with one short drive.
InsteadUse the same recording and trigger over the conditions that caused the fault.
Summary and key terms
- Graphs show history, glitches and relationships that a list of numbers hides.
- Scan tool update rates fall as more parameters are recorded; record a short list for intermittent faults.
- Set triggers so the recording keeps the data around the event.
- Read the graph for what changed first; cause comes before effect.
- Statistics and step checks find impossible values in long recordings.
- Correlation and lag show whether partner parameters move together.
- A one-sample drop to an extreme value usually means an intermittent open or poor connection.
- Recording
- Scan data saved over time, often in a loop that keeps data around a trigger.
- Trigger
- The event that tells a recording to save the data before and after it.
- Update rate
- How many times per second a scan tool receives a new value for each parameter.
- Dropout
- A brief loss of a signal, often seen as a jump to an extreme value.
- Correlation
- A measure from minus one to one of how closely two values move together.
- Lag
- How far one value trails another in time.
- Fretting corrosion
- Oxidation caused by tiny repeated movement of a connection under vibration and heat.
Practice problems
Work each problem on paper first, then reveal the answer to check.
Why did a coolant temperature of minus forty point to an open circuit?
Show answer
An open sensor circuit looks to the module like an extremely cold sensor.
Why do averages hide glitches?
Show answer
A few extreme samples among many normal ones change the average only slightly.
What does a lag of one tenth of a second between throttle and airflow indicate?
Show answer
Normal intake filling after a throttle snap.
Why did the fault appear more on a hybrid?
Show answer
The engine starts and stops many times a day, adding vibration and heat cycles at the connector.
Lesson quiz · 5 questions
Score 60% or more to complete this lesson.
Create a free account to save your progress, take quizzes and earn a certificate.