
ARCH-400 · Lesson 7 of 12 · 22 min
Energy modelling
Priyanka Sethi, the energy modelling consultant who has worked with the students since second year, sets up her laptop in the big room in week six and shows the team a model of Marlow Station that Adaeze has built with her help: eleven floors of thermal zones, each with its use, its schedule, its envelope and its system, running through every hour of a typical year of Winnipeg weather in a few minutes. 'This is not the building,' she says. 'It is a set of assumptions about the building that we can argue about. The value of the model is that it makes the assumptions visible.'
What an energy model is
A whole-building energy model is a calculation of how much energy a building will use, hour by hour, for a year. The building is divided into thermal zones, groups of spaces with similar uses and exposures. For each zone the model needs the geometry and the construction of its walls, roof, floors and windows; the schedules of its occupants, lights and equipment; its setpoints; and the systems that heat, cool and ventilate it. It then calculates, for each hour of a weather file representing a typical year at the site, the heat flowing through the envelope, the heat given off inside, the air brought in and exhausted, and the energy the systems use to keep each zone within its setpoints. The results are usually reported by end use: heating, cooling, fans, pumps, lighting, equipment and hot water.
Energy models are used in two quite different ways. In design, they compare options: a better window or a smaller one, heat recovery or none, this system or that. Here what matters is the difference between runs, which is usually more reliable than the absolute number. For code compliance, under a performance path, they compare the proposed building with a reference building defined by the code, and the proposed building must use no more than the reference. In Manitoba, large buildings must meet the 2020 National Energy Code for Buildings, enforced since January 2024; its performance path compares the proposed building with a reference building modelled under rules the code sets out. Sethi asks the team to keep the two uses apart. 'A compliance model answers a legal question,' she says. 'A design model answers the question you are actually asking.'
Timing matters as much as method. A model built at the end of design development, to prove compliance, can do little more than confirm what has already been decided. A model built in the concept stage, even a simple one, can change the form, the window share and the system choice while they are still cheap to change. That is why Sethi and Adaeze built the first model of Marlow Station from the team's massing in week four, with default assumptions for everything not yet decided, and why they will refine it every two weeks until the final presentation.
Three users, three energy profiles
The model shows how differently the three users behave. The homes are occupied all the time, with modest internal gains, and most of their energy goes to space heating, ventilation and hot water; their energy use per unit of floor area is the lowest of the three. The clinic is occupied about seventy hours a week, but its exam rooms are full of people, lights and equipment, and it needs far more fresh air per unit of floor area than the homes; it needs cooling for much of the year, even in winter in its interior zones, and its energy use per unit of floor area is the highest. The transit hall's energy is dominated by its doors: a thousand openings a day in January, each letting in a gust of −25 °C air, outweigh everything else.
These differences are what make the heat recovery chiller worth its cost. At most hours of the year, the clinic is rejecting heat while the homes need hot water. A chiller that moves the clinic's heat into the homes' hot water tanks replaces two energy uses with one. The model shows that heat recovery cuts the building's heating energy by about a fifth, and the clinic's cooling energy by more than half, because the heat pumps on the roof rarely need to reject heat to the outdoors.
Comparing the options
Sethi and Adaeze run three versions of the building, with the same form and envelope. The first is a code baseline with gas boilers for heating and hot water and a conventional cooling plant, the system a developer might choose by default if the clients had not ruled out gas. The second uses air-to-water heat pumps on the roof for heating, cooling and hot water, with no heat recovery between users. The third adds the heat recovery chiller, the transit hall's vestibules and air curtains, and the improved envelope Adaeze and Ingrid have agreed: a window share of about 35% instead of 45%, triple glazing, and an airtightness target the builder believes he can meet. The script below sets out the energy use of each part in each option and calculates the building's energy use intensity and its greenhouse gas emissions in this grid.
# Energy options for the station building: use by part, and greenhouse gas in this grid
area = {"homes": 7000, "clinic": 2700, "transit and retail": 2200}      # m2
grid = 0.002                    # kg CO2e per kWh of electricity (approximate)
gas = 0.18                       # kg CO2e per kWh of natural gas burned (approximate)
options = {   # EUI by part in kWh/m2, and the share of heat from gas
    "1 code baseline, gas boilers":         ({"homes": 140, "clinic": 230, "transit and retail": 210}, 0.55),
    "2 air-to-water heat pumps":           ({"homes": 80, "clinic": 150, "transit and retail": 150}, 0.0),
    "3 heat pumps + heat recovery + doors": ({"homes": 62, "clinic": 118, "transit and retail": 95}, 0.0),
}
total_area = sum(area.values())
for name, (eui, gas_share) in options.items():
    kwh = sum(eui[k] * area[k] for k in area)
    ghg = kwh * ((1 - gas_share) * grid + gas_share * gas) / 1000
print(f"{name:<38} EUI {kwh / total_area:5.1f} kWh/m2, {kwh / 1e6:4.2f} GWh, {ghg:6.0f} t CO2e per year")1 code baseline, gas boilers EUI 173.4 kWh/m2, 2.06 GWh, 206 t CO2e per year 2 air-to-water heat pumps EUI 108.8 kWh/m2, 1.29 GWh, 3 t CO2e per year 3 heat pumps + heat recovery + doors EUI 80.8 kWh/m2, 0.96 GWh, 2 t CO2e per year
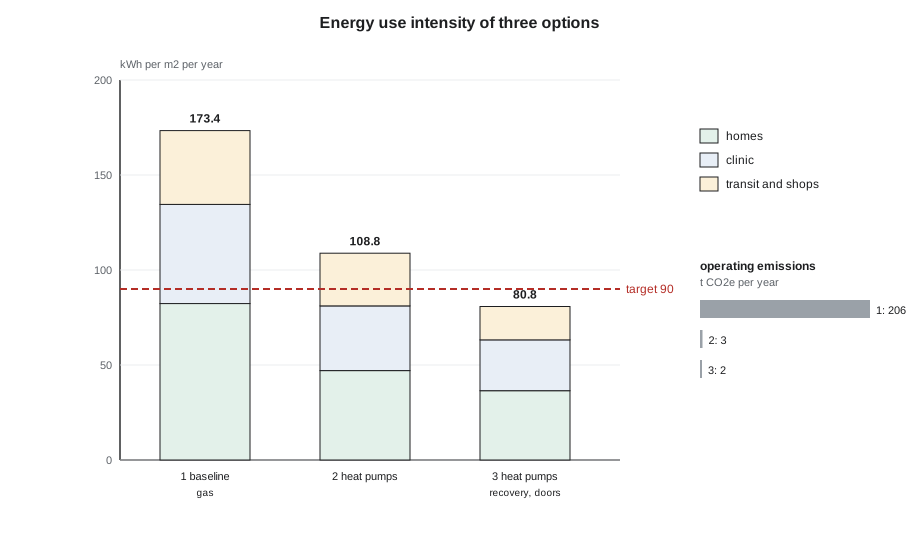
The heat pumps alone bring the building close to the target; heat recovery, the doors and the envelope bring it comfortably below, at about 81 kWh/m² against a target of 90. The margin matters, because energy models of new buildings usually underestimate actual use: occupants behave differently from the schedules, systems are not commissioned perfectly, and plug loads grow. Sethi says she likes a margin of about 10% at this stage, and the team has it.
The greenhouse gas results tell a different story. Manitoba's grid is almost entirely hydroelectric, with emissions of only a few grams of carbon dioxide equivalent per kilowatt-hour, so an all-electric building in Winnipeg has almost no operating emissions, whatever its energy use. The baseline with gas boilers emits about 200 tonnes a year, nearly all from the gas; the all-electric options emit about 2 or 3. In this grid, the decision to go all-electric does almost all the work, and saving energy matters mainly for cost, for the grid's capacity on the coldest days and for the residents' bills.
Sensitivity and uncertainty
The team asks Sethi which assumptions matter most. She runs a simple sensitivity test, changing one input at a time by a reasonable amount and recording the change in the building's energy use. The largest effects come from four inputs: the airtightness of the envelope, the effectiveness of the homes' energy recovery ventilators, the transit hall's door openings and the clinic's ventilation rates. The window share and the glazing type matter less than the students expected, because the envelope is already good. Sethi notes that the first two are matters of construction quality: a building whose air barrier leaks twice as much as designed, or whose ventilators are installed with long, leaky ducts, will miss its target by more than any design decision could recover.
This finding goes into the decision log, and it changes the team's plans in two ways. The specification will require an airtightness test of the whole building before the interior finishes close the walls, with a target the builder has agreed to, and each home's ventilator will be tested for its delivered flow. And the team asks Marcus Oyelaran whether his firm can build a mock-up of a typical home's wall and window early in construction, so that the airtightness and the ventilator installation can be tested and corrected before they are repeated ninety-six times. He says yes, and that his firm has started doing it on every multi-unit project because it saves them money too.
Sethi also warns the team about the weather. A typical year is an average, and the coldest week of a real winter can be much colder. The heat pumps' capacity at the coldest hours, which the students studied in third year, is a separate question from the annual energy, and Adaeze checks it with the design temperature and the heat pumps' capacity at that temperature. She finds that the roof heat pumps can carry the design night with the storage tanks and the heat recovery chiller's contribution, with a small electric boiler as backup. Sethi adds that future-climate weather files are now available and that a building designed to last sixty years should be tested against them, for summer overheating as well as winter heating.
Worked problem
Why the margin matters
The model predicts an energy use intensity of 81 kWh/m² against a target of 90. Studies of completed buildings often find actual use 10 to 30% above design predictions. If actual use is 15% above the prediction, does the building still meet its target?
Show solution
- Multiply the prediction by 1.15: 81 × 1.15 = 93 kWh/m².
- Compare with the target: 93 is above 90.
- So a 15% gap would miss the target by about 3%.
- The team's response is not to pad the model but to reduce the gap: airtightness and ventilator testing, commissioning, and metering each user separately so that problems can be found and fixed in the first year.
Answer: No; a 15% performance gap would miss the target, so the team focuses on the construction and commissioning measures that close the gap.
Exercise 7: energy modelling
- Build a simple energy model of your building at the concept stage, and refine it at each review.
- Report energy use by end use and by user, and compare at least three options against your target.
- Calculate operating greenhouse gas emissions in your grid, and say what the grid factor means for your design priorities.
- Test the sensitivity of the result to at least four inputs, and record what the construction and commissioning must achieve.
Self-check
- Can you say which of your model's assumptions matter most?
- Is your margin against the target large enough to absorb a realistic performance gap?
- Have you checked the coldest hours as well as the annual total?
Reading the model's results
Sethi asks the students to read the model's output as an engineer would, not as a single number. The building's energy use intensity is the headline, but the end-use breakdown tells the team where to work. In the third option, space heating for the homes and the transit hall is still the largest single use, followed by ventilation fans, domestic hot water, the clinic's lighting and equipment, and the heat pumps' own pumps. Lighting is small, because the team has specified efficient fixtures and daylight controls, and cooling is small, because the heat recovery chiller does most of it. The breakdown also shows something the total hides: the clinic, with about a quarter of the floor area, uses about a third of the energy, and the homes, with more than half the floor area, use less than half. When Okafor later looks for savings, he will know that a small change to the clinic's ventilation is worth more than a large change to the homes' lighting.
Sethi also asks the team to check the model against simple calculations, because models can be wrong in ways that look plausible. Adaeze compares the model's peak heating load with a hand calculation of the envelope and ventilation losses at the design temperature, and finds them within about 10% of each other. She compares the domestic hot water use with the published typical use per resident and finds the model's schedule close. One check fails: the model shows the transit hall using almost no energy at night, when it is open until one in the morning. The hall's schedule had been copied from a retail store. Corrected, the hall's heating rises by about a fifth. 'Every model has a mistake like this,' Sethi says. 'The question is whether you find it before the owners do.'
Common mistakes
MistakeBuilding the energy model only to prove compliance at the end.
InsteadBuild a simple model at the concept stage and use it to choose.
MistakeReading the absolute result as a prediction.
InsteadTrust differences between runs more than absolute numbers, and keep a margin.
MistakeAssuming energy and carbon are the same everywhere.
InsteadApply your grid's emission factor; it changes what matters most.
MistakeIgnoring the doors of a busy public space.
InsteadModel door openings and design vestibules and air curtains.
MistakeLeaving airtightness to luck.
InsteadSpecify a target, test a mock-up early and test the whole building before finishes.
Summary and key terms
- A whole-building energy model calculates hourly energy use for a year from zones, envelope, schedules, systems and a weather file, and makes the assumptions visible.
- Design models compare options; compliance models compare the building with a code reference; they answer different questions.
- The homes, clinic and transit hall have very different energy profiles, which makes heat recovery between them worthwhile.
- Heat pumps, heat recovery, vestibules and a better envelope bring the building to about 81 kWh/m², about 10% below the target.
- In Manitoba's hydroelectric grid, going all-electric removes almost all operating emissions; airtightness and ventilation quality matter most for the result.
- Energy model
- A calculation of a building's energy use, hour by hour, over a typical year.
- Thermal zone
- A group of spaces with similar use and exposure, modelled together.
- End use
- A category of energy use, such as heating, cooling, lighting or hot water.
- Grid emission factor
- The greenhouse gas emitted per unit of electricity from a grid.
- Performance gap
- The difference between predicted and actual energy use.
Practice problems
Work each problem on paper first, then reveal the answer to check.
A building of 11,900 m² uses 0.96 GWh a year. What is its EUI?
Show answer
960,000 / 11,900 = about 81 kWh/m².
At 0.002 kg per kWh, what are the operating emissions of 0.96 GWh?
Show answer
About 2 tonnes a year.
Which four inputs had the largest effect on the result?
Show answer
Airtightness, ventilator effectiveness, transit hall door openings and clinic ventilation rates.
Why build a wall and window mock-up early in construction?
Show answer
To test and correct airtightness and ventilator installation before they are repeated.
What energy code applies to large buildings in Manitoba?
Show answer
The 2020 National Energy Code for Buildings, enforced since January 2024.
What backs up the heat pumps on the coldest night?
Show answer
The storage tanks, the heat recovery chiller and a small electric boiler.
Lesson quiz · 5 questions
Score 60% or more to complete this lesson.
Create a free account to save your progress, take quizzes and earn a certificate.