
AERO-499 · Lesson 10 of 12 · 23 min
Cost and schedule
Requirement R9 is the reason the project exists: the Plover E2 must cost the school no more than 60 per cent of its piston trainer per flight hour. Whether it does depends on what the aircraft costs to build, what the sponsor must charge for it to recover the cost of developing it, and what it costs to fly. In weeks 20 to 22 Priya and Owen build the cost model, with Kenji as mentor, while the rest of the team finishes the certification plan. This lesson covers how aerospace costs are estimated, what the Plover E2 estimate shows, how the development programme would be scheduled, and how the team tracks the cost and schedule of its own project with earned value.
Life-cycle cost and how to estimate it
The life-cycle cost of an aircraft is the sum of what is spent on it from the first study to disposal: research and development, including certification; production; operation, which includes energy, crew, maintenance, insurance and replacement parts; and disposal. For a manufacturer the first two decide whether the product makes money. For an operator such as the school, the price of the aircraft and its operating cost decide whether to buy it. The two are linked, because the price must recover development.
There are three ways to estimate costs, and they suit different stages. Estimating by analogy scales the known cost of a similar product, which is quick but only as good as the similarity. Parametric estimating uses statistical relations between cost and a few design parameters, such as empty mass, speed and production quantity, fitted to historical programmes; it is the standard method at the concept and preliminary stages. Bottom-up estimating adds the cost of every part, every hour of labour and every test, which needs a detailed design and is the method used for firm quotations. The team uses a parametric model for development and production, checked by analogy against the published costs of small aircraft programmes, and a bottom-up model for operating cost, where the school's records give real numbers.
A parametric model for development and production
The team uses the hour relations of the DAPCA IV model, in the form widely reproduced in aircraft design textbooks. They estimate engineering, tooling and manufacturing hours from the empty mass in pounds, the maximum speed in knots and the production quantity:
The model was fitted to military and transport aircraft, and Kenji warns that it must be calibrated before use on a light aircraft. The team applies a factor of 0.45 to manufacturing hours, which brings the model into line with the hours Borealis Aerospace records for its own composite parts, and no reduction at all to engineering and tooling, because the electric drive and battery are new to the company and certification of novel features has historically taken much more engineering than parametric models predict. Hourly rates are fully burdened: they include salaries, benefits, overheads and facilities.
# Plover E2 cost estimate (illustrative): development by a DAPCA-style parametric model, then cost per flight hour
We_lb, V_kt, Q = 580 * 2.2046, 95, 200          # empty mass (lb), maximum speed (knots), five-year production
H_E = 4.86 * We_lb**0.777 * V_kt**0.894 * Q**0.163     # engineering hours (DAPCA IV form)
H_T = 5.99 * We_lb**0.777 * V_kt**0.696 * Q**0.263     # tooling hours
H_M = 7.37 * We_lb**0.82 * V_kt**0.484 * Q**0.641      # manufacturing hours
k_dev = 1.00                                     # development: no reduction, the electric drive is new to the sponsor
k_mfg = 0.45                                     # manufacturing: calibration for a light aircraft built in composite moulds
rates = {'E': 140, 'T': 105, 'M': 85}            # Canadian dollars per hour, fully burdened (illustrative)
dev = k_dev * (H_E * rates['E'] + H_T * rates['T'])
mfg = k_mfg * H_M * rates['M']
battery_kwh, pack_cost = 59.1, 900               # dollars per kWh for an aviation-grade pack (illustrative)
bought = 95_000 + battery_kwh * pack_cost        # motor, inverter, avionics, interior, propeller, plus packs
unit = mfg / Q + bought
print(f'engineering {k_dev*H_E/1e3:.0f} k h, tooling {k_dev*H_T/1e3:.0f} k h, manufacturing {k_mfg*H_M/Q:.0f} h per aircraft')
print(f'development and tooling {dev/1e6:.1f} million; recurring cost per aircraft {unit/1e3:.0f} thousand Canadian dollars')
price = (unit + dev / Q) * 1.10                 # recover development over Q aircraft, 10 % margin
print(f'development spread over {Q} aircraft: {dev/Q/1e3:.0f} thousand per aircraft; price {price/1e3:.0f} thousand')

hours_year = 800
def per_hour(name, energy, maint, reserve, insurance, price):
    capital = price * 0.075 / hours_year          # 7.5 % a year for depreciation and interest (illustrative)
    total = energy + maint + reserve + insurance + capital
    print(f'{name:20s} energy {energy:6.2f}  maintenance {maint:5.1f}  overhaul/pack reserve {reserve:5.1f}  insurance {insurance:5.1f}  capital {capital:5.1f}  = {total:6.1f} per hour')
    return total
kwh_per_hour = 34.0 / 0.92                       # average lesson power plus charging losses
e = per_hour('Plover E2', kwh_per_hour * 0.11, 28.0, battery_kwh * pack_cost / (2000 * 0.85), 18.0, price)
p = per_hour('piston trainer', 28 * 2.60, 55.0, 32.0, 16.0, 520_000)
print(f'Plover cost is {e/p*100:.0f} % of the piston trainer (requirement R9: no more than 60 %)')
for q in (100, 200, 400, 800):
    pr = (unit + dev / q) * 1.10
    cap = pr * 0.075 / hours_year
    tot = e - price * 0.075 / hours_year + cap
print(f' production {q:3d}: price {pr/1e3:4.0f} thousand, cost per hour {tot:6.1f} = {tot/p*100:3.0f} % of piston')engineering 175 k h, tooling 149 k h, manufacturing 1583 h per aircraft development and tooling 40.2 million; recurring cost per aircraft 283 thousand Canadian dollars development spread over 200 aircraft: 201 thousand per aircraft; price 532 thousand Plover E2 energy 4.07 maintenance 28.0 overhaul/pack reserve 31.3 insurance 18.0 capital 49.9 = 131.2 per hour piston trainer energy 72.80 maintenance 55.0 overhaul/pack reserve 32.0 insurance 16.0 capital 48.8 = 224.6 per hour Plover cost is 58 % of the piston trainer (requirement R9: no more than 60 %) production 100: price 753 thousand, cost per hour 151.9 = 68 % of piston production 200: price 532 thousand, cost per hour 131.2 = 58 % of piston production 400: price 421 thousand, cost per hour 120.9 = 54 % of piston production 800: price 366 thousand, cost per hour 115.7 = 52 % of piston
The model gives about 175,000 engineering hours and 149,000 tooling hours, and a development and tooling cost of about 40 million Canadian dollars. Each aircraft takes about 1,600 manufacturing hours and, with bought-in equipment and the battery packs, costs about 283,000 dollars to build. Spreading development over 200 aircraft adds 201,000 dollars to each, and with a 10 per cent margin the price is about 532,000 dollars. That is close to the price the school would pay for a new four-seat piston trainer, which is a reality check Kenji likes: the market will not pay much more.
The production quantity in the estimate is the most uncertain number in the whole project. Two hundred aircraft over five years is the sponsor's marketing estimate for flight schools in North America replacing part of their ageing two-seat fleets; Élise considers it plausible but not conservative. The development cost is the second most uncertain. Rachel points out that the first certified electric aeroplanes took far longer to certify than their makers planned, and that the novel parts of the Plover E2, the battery installation and the propulsion unit, will need special conditions written and tests agreed for the first time.
Cost per flight hour
The operating cost per flight hour is built from the bottom up, using the school's records for its piston fleet and the team's estimates for the Plover E2. It has five parts. Energy is electricity for the Plover E2, at about 11 cents per kilowatt-hour, and avgas at about 2.60 dollars a litre for the piston trainer. Maintenance includes the scheduled inspections and unscheduled repairs, which for the electric aircraft are lower because the motor has one moving part and no oil, spark plugs, cylinders or exhaust. The reserve for replacement is the battery for the Plover E2, a pack set replaced every 2,000 cycles at 85 per cent capacity, and the engine overhaul for the piston trainer. Insurance is slightly higher for the new type, at least until there is a claims history. And the capital cost, depreciation and interest on the price, is spread over the school's 800 flight hours a year.
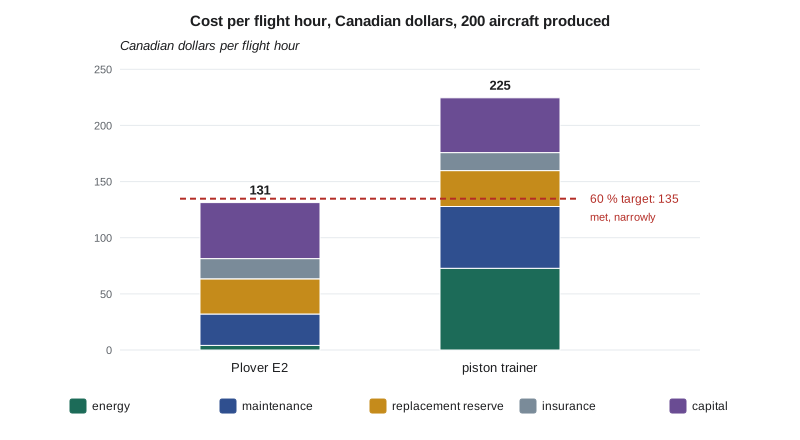
With 200 aircraft the Plover E2 costs about 131 dollars per flight hour against 225 for the piston trainer, 58 per cent, and meets R9 narrowly. The breakdown changes completely between the two. Fuel is the piston trainer's largest cost, 73 dollars an hour; electricity for the Plover E2 is about 4. But the battery replacement reserve, 31 dollars an hour, takes its place: a 59 kWh aviation pack at an illustrative 900 dollars per kilowatt-hour costs 53,000 dollars and lasts about 1,700 flight hours. The energy cost is so low largely because of Manitoba's electricity, almost all of it from hydro stations, which also means that the Plover E2's operating emissions are close to zero.
The production sensitivity at the end of the output shows what the result depends on. With only 100 aircraft, the price rises because development is spread over fewer units, and the cost per hour reaches 68 to 75 per cent of the piston trainer; with 400 it falls to 54 to 58 per cent. The team's honest summary is that the Plover E2 meets the cost target only if the sponsor sells a few hundred aircraft, and that the target is harder to meet where fuel is cheap. Two other sensitivities matter almost as much: the battery price, which suppliers expect to fall, and the battery cycle life, which the team has not been able to measure. A pack that lasts 3,000 cycles instead of 2,000 would cut the battery reserve by a third.
The development schedule
Kenji asks the team for a development schedule, because time is money twice over: engineering hours cost money, and every year without sales delays the return. The team builds it from the work identified in the certification plan and the flight test programme from lesson 8.
| Phase | Duration | Main work |
|---|---|---|
| Detailed design | 18 months | Complete drawings, analyses and supplier selection; certification basis agreed |
| Prototype build and ground test | 12 months | Two flight test aircraft, iron bird, structural test article |
| Flight test and certification | 18 months | About 450 flight hours, structural and battery tests, compliance findings |
| Production start | 6 months, overlapping | Tooling, production approval, first deliveries |
The schedule runs about four years from a decision to launch the programme to the first delivery. Kenji considers it aggressive for a company that has never certified an electric aircraft, and he would add a year of schedule reserve; the critical path runs through battery qualification and the special conditions, which depend on the regulator as well as the company.
Earned value on the capstone itself
The team applies the same discipline to its own project. Earned value management compares three numbers at any date: the planned value, the budgeted cost of the work scheduled to be done by then; the earned value, the budgeted cost of the work actually done; and the actual cost, what the work done actually cost. For a student project the currency is hours. From these come two indices: the cost performance index, earned value over actual cost, and the schedule performance index, earned value over planned value. Values below 1 mean over budget and behind schedule.
# Earned value check at week 13 of the capstone (hours are the currency of a student project)
tasks = [  # name, budget hours, planned % complete at week 13, actual % complete, actual hours spent
    ('Requirements and certification basis', 120, 100, 100, 135),
    ('Concepts and selection', 160, 100, 100, 150),
    ('Sizing and layout', 150, 100, 90, 170),
    ('Aerodynamics and performance', 140, 60, 50, 95),
    ('Structures and loads', 140, 60, 30, 60),
    ('Battery cell test rig', 110, 75, 40, 70),
    ('Subscale demonstrator', 200, 0, 5, 12),
    ('Report and presentation', 180, 0, 0, 0)]
BAC = sum(t[1] for t in tasks)
PV = sum(t[1] * t[2] / 100 for t in tasks)
EV = sum(t[1] * t[3] / 100 for t in tasks)
AC = sum(t[4] for t in tasks)
CPI, SPI = EV / AC, EV / PV
print(f'budget at completion {BAC} h; planned value {PV:.0f} h; earned value {EV:.0f} h; actual cost {AC} h')
print(f'cost performance index {CPI:.2f}; schedule performance index {SPI:.2f}')
print(f'estimate at completion (CPI method) {BAC/CPI:.0f} h; variance at completion {BAC - BAC/CPI:.0f} h')
print(f'estimate at completion (CPI x SPI method) {AC + (BAC - EV)/(CPI*SPI):.0f} h')
team, weeks_left, h_per_week = 5, 13, 10
print(f'team capacity for the rest of the project: {team*weeks_left*h_per_week} h against {BAC/CPI - AC:.0f} h still needed')
for name, bud, pl, act, hrs in tasks:
    ev, pv = bud * act / 100, bud * pl / 100
if pv and ev / pv < 0.8: print(f' behind: {name} (earned {ev:.0f} of {pv:.0f} planned hours)')budget at completion 1200 h; planned value 680 h; earned value 581 h; actual cost 692 h cost performance index 0.84; schedule performance index 0.85 estimate at completion (CPI method) 1429 h; variance at completion -229 h estimate at completion (CPI x SPI method) 1556 h team capacity for the rest of the project: 650 h against 737 h still needed behind: Structures and loads (earned 42 of 84 planned hours) behind: Battery cell test rig (earned 44 of 82 planned hours)
At week 13 the numbers are sobering. The team has earned 581 hours of work against 680 planned, and spent 692 hours doing it. Both indices are about 0.85: the team is 15 per cent behind schedule and 15 per cent over budget. At that rate the project would need 1,430 to 1,560 hours against the 1,200 budgeted, and the team has 650 hours of capacity left against 737 still needed. The two work packages furthest behind are the structures and the battery test rig.
The analysis does what it is meant to do: it turns a vague feeling that things are slipping into numbers and names. The team acts at once. Fatima's structures work had been slowed by waiting for the final layout, so the wing move from lesson 6 is frozen early and she proceeds. The battery rig had been waiting for the climatic chamber, which another group was using; Lucas books evening slots. The subscale demonstrator's glide tests, which the plan in lesson 1 had named as the first item to cut, are kept for the moment, but the team agrees that if the indices have not improved by week 18 they go. By week 18 the schedule index has recovered to 0.95 and the glide tests stay.
Worked problem
Earned value at a review
At a review the planned value is 400 h, the earned value 340 h and the actual cost 380 h, with a budget at completion of 1,000 h. Find the indices and the estimate at completion.
Show solution
- \(\text{CPI} = 340/380 = 0.89\).
- \(\text{SPI} = 340/400 = 0.85\).
- \(\text{EAC} = 1000/0.89 = 1{,}118\) h.
- The project is behind schedule and over budget; the estimate at completion is about 12 per cent over budget if performance does not improve.
Answer: CPI 0.89, SPI 0.85, estimate at completion about 1,120 h.
Common mistakes
MistakeUsing a parametric model outside its database without calibration.
InsteadCalibrate it against known costs for similar products and say how.
MistakePricing the aircraft at its recurring cost.
InsteadRecover development over a realistic production quantity, and show the sensitivity to that quantity.
MistakeComparing energy costs only.
InsteadInclude battery replacement, maintenance, insurance and capital, which change the answer.
MistakeTracking hours spent as if they were progress.
InsteadUse earned value: progress is the budgeted value of work completed, not hours used.
Summary and key terms
- Life-cycle cost covers development, production, operation and disposal; parametric models suit the early stages and must be calibrated.
- A DAPCA-style estimate, with no reduction for development and a 0.45 factor for manufacturing, gives about 40 million Canadian or 36 million US dollars of development and a price of about 532,000 or 452,000 dollars with 200 aircraft.
- Cost per flight hour is about 58 per cent of the piston trainer in Canada and 64 per cent in the US; the battery replacement reserve replaces fuel as the largest variable cost, and the result depends strongly on production quantity, battery price and cycle life.
- Development would take about four years.
- Earned value on the capstone at week 13 gave CPI and SPI of about 0.85, which prompted corrective actions.
- Life-cycle cost
- Total cost from first study to disposal.
- Parametric estimate
- Cost from statistical relations to design parameters.
- Fully burdened rate
- Hourly rate including salary, benefits and overheads.
- Earned value
- Budgeted cost of the work actually completed.
- Cost performance index
- Earned value divided by actual cost.
- Schedule performance index
- Earned value divided by planned value.
Practice problems
Work each problem on paper first, then reveal the answer to check.
Why does the team apply no reduction to the development hours?
Show answer
The electric drive and battery are new to the company, and certification of novel features takes more engineering than parametric models predict.
What replaces fuel as the largest variable cost of the electric aircraft?
Show answer
The battery replacement reserve.
Why does the electric aircraft save less in the United States?
Show answer
Avgas is cheaper there, so the fuel cost it avoids is smaller.
What does a CPI of 0.84 mean?
Show answer
Each hour spent earns 0.84 hours of budgeted work; at that rate the project would finish about 19 per cent over budget.
How would a 3,000-cycle battery change the battery reserve?
Show answer
It would fall by about a third.
Lesson quiz · 5 questions
Score 60% or more to complete this lesson.
Create a free account to save your progress, take quizzes and earn a certificate.