
ACCT-341 · Lesson 9 of 12 · 30 min
Dashboards and communicating insights
Analysis creates value only when it changes what someone does. This lesson covers the last two steps of the analytics cycle: communicating insights and tracking outcomes. It looks first at dashboards, the interactive displays that let managers monitor performance continuously, and then at communicating the results of a specific analysis in a memo or presentation. Both rely on the visualization principles from lesson 8. Both also depend on something less visible: a well-designed, well-governed data model behind the display, without which the most attractive dashboard is a polished way of spreading errors.
What a dashboard is for
A dashboard is a visual display of the most important information needed to achieve one or more objectives, arranged so it can be monitored at a glance. That definition, adapted from the information designer Stephen Few, contains the key design constraints. A dashboard is about objectives, so every element should relate to a goal or decision. It shows the most important information, so it is selective. And it is monitored at a glance, so it must be readable in seconds, usually on one screen.
| Type | Audience | Refresh | Cedarbrook example |
|---|---|---|---|
| Strategic | Board and executives | Monthly or quarterly | Revenue, margin, cash and return on capital against the plan |
| Operational | Managers running a process | Daily or real time | Orders shipped, backorders, cash receipts, overdue invoices by branch |
| Analytical | Analysts and finance staff | As needed | Margin by customer and product with drill-down filters |
Mixing these purposes is a common cause of cluttered dashboards. A board does not need daily shipping counts, and a warehouse supervisor does not need return on capital. Designing separate dashboards for separate audiences, sharing the same underlying data, is usually better than one dashboard that tries to serve everyone.
Choosing the measures
The hardest part of dashboard design is deciding what to measure. Key performance indicators (KPIs) should be tied to objectives, few in number, clearly defined, and within the influence of the people who see them. A useful test for each candidate KPI is to ask what action someone would take if it moved. If the answer is none, it does not belong on the dashboard.
Good dashboards balance lagging indicators, which report outcomes after the fact, such as gross margin and profit, with leading indicators, which signal future outcomes, such as quotes issued, order backlog or the share of receivables more than 60 days overdue. They also balance financial and non-financial measures, an idea familiar from the balanced scorecard. And every KPI needs a precise definition, recorded in a KPI dictionary: exactly how it is calculated, from which data, at what level and with what target. Two managers who calculate days sales outstanding differently will argue about the numbers instead of the business.
Measures also change behaviour, sometimes in unwanted ways. Goodhart's law, often summarized as "when a measure becomes a target, it ceases to be a good measure," warns that people will find ways to hit a target that do not serve the underlying goal. A branch rewarded on revenue alone might win revenue with deep discounts, as West appears to have done. Pairing measures, such as revenue with margin, or on-time shipment with error rates, reduces this risk.
Status and targets
Dashboards usually compare each KPI with a target and show a status, often with traffic-light colours. Status rules should be explicit and consistent, not left to the colour picker. The program below computes the tiles for Cedarbrook's monthly branch dashboard for December 2025: the value, the direction of change from the previous month and whether that direction is good, and a status of on target, watch or act based on the distance from target and a tolerance for each KPI.
# KPI tiles for the monthly branch dashboard: value, trend and status
kpis = [  # name, this month, last month, target, higher_is_better, tolerance
    ("Gross margin %",          21.9, 22.4, 24.0, True,  1.0),
    ("Days sales outstanding",  44.0, 42.5, 40.0, False, 3.0),
    ("Inventory turns (annual)", 6.1,  6.0,  6.0, True,  0.5),
    ("Orders shipped on time %", 96.2, 94.8, 95.0, True, 2.0),
    ("Operating expenses % rev", 17.4, 17.9, 17.0, False, 1.0),
]
def status(value, target, higher, tol):
    gap = (value - target) if higher else (target - value)
    if gap >= 0:
        return "on target"
    return "watch" if -gap <= tol else "act"
print(f"{'KPI':<26}{'value':>7}{'trend':>8}{'target':>8}  status")
for name, now, prev, target, higher, tol in kpis:
    better = (now > prev) == higher
    arrow = ("up" if now > prev else "down") + ("+" if better else "-")
    print(f"{name:<26}{now:>7.1f}{arrow:>8}{target:>8.1f}  "
f"{status(now, target, higher, tol)}")KPI value trend target status Gross margin % 21.9 down- 24.0 act Days sales outstanding 44.0 up- 40.0 act Inventory turns (annual) 6.1 up+ 6.0 on target Orders shipped on time % 96.2 up+ 95.0 on target Operating expenses % rev 17.4 down+ 17.0 watch
Two KPIs need action. Gross margin is 2.1 points below target and getting worse, and days sales outstanding is 4 days above target and rising. Operating expenses are slightly above target but improving, so they are on watch. Inventory turns and on-time shipping are on target. Note that the direction of the arrow and whether the change is good are separate questions: a rising DSO is bad, while a rising on-time rate is good. Dashboards that colour every upward arrow green confuse readers. Also notice that status depends on tolerances someone chose; those thresholds are judgments that should be documented and reviewed, because a status of on target can create false comfort if the tolerance is too wide.
Layout and interaction
Readers of left-to-right languages tend to scan a screen from the top left, so the most important information belongs there. A common layout puts a row of KPI tiles across the top, each with its value, target, trend and status, followed by a few charts that explain the main KPIs, with detail and filters below or on separate pages. Keep to a limited number of visuals on a page, often cited as no more than about seven to nine, align elements on a grid, and use white space to group related items.
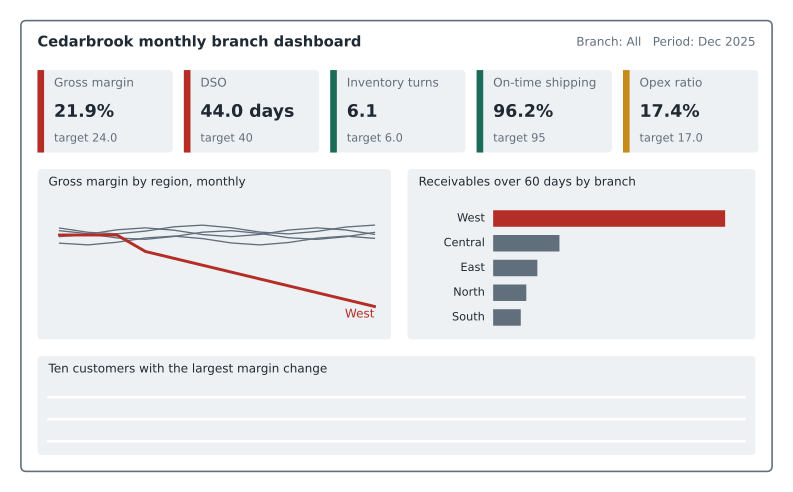
Interactivity lets one dashboard serve several questions without clutter. Filters and slicers restrict all visuals to a branch, period or customer group. Drill-down moves from a total to its components, such as from region to branch to customer. Drill-through jumps from a summary to a detail page for the selected item. Tooltips show extra information on hover. Interactivity should support the dashboard's purpose, not replace design; a dashboard that only makes sense after a dozen clicks has failed at the glance test.
Worked problem
Redesigning a cluttered dashboard
Cedarbrook's existing sales dashboard has 22 visuals on one page, including six gauges, three pie charts, a map of branch locations and a word cloud of product names. Managers say they never use it. How should Maya approach the redesign?
Show solution
- Interview the users: what decisions do they make each month, and what do they need to know to make them?
- Select five or six KPIs tied to those decisions, define each in a KPI dictionary, and agree targets and tolerances.
- Replace gauges with KPI tiles or bullet charts, pies with sorted bar charts, and drop the map and word cloud, which answer no one's question.
- Put the KPIs at the top, two or three explanatory charts below, and detail on a drill-through page.
- Test the draft with users, asking what they conclude in the first ten seconds, and track whether they use it.
Answer: Start from decisions, cut to a few defined KPIs, use effective chart types, and test with users.
The data model behind the dashboard
Business intelligence tools such as Power BI and Tableau work best with data organized as a star schema. At the centre is a fact table holding measurements, such as revenue and quantity, with one row per event or per period at a defined grain. Around it are dimension tables holding descriptive attributes, such as branch, customer, product and date, each linked to the fact table by a key. The structure is called a star because a diagram of it looks like one. Filters on a dimension, such as choosing the West branch, flow to the fact table through the key.
A star schema is only as reliable as its keys and its grain. If the fact table has two rows where the grain says there should be one, measures double. If a fact row has a key that matches no dimension row, it either disappears from filtered views or appears under a blank label, depending on the tool. If a dimension is missing a period, the dashboard may skip it silently. These are the join problems of lesson 4 in a new setting, and the same checks apply. Before publishing a dashboard, Maya tests her model.
# Checking a star schema before building a dashboard on it
import pandas as pd
dim_branch = pd.DataFrame({"branch_key": [1, 2, 3, 4, 5],
    "branch": ["North", "Central", "South", "East", "West"]})
dim_date = pd.DataFrame({"date_key": [202510, 202511, 202512],
    "fiscal_period": ["2025-10", "2025-11", "2025-12"]})
fact_sales = pd.DataFrame({            # grain: one row per branch per month
    "branch_key": [1, 2, 3, 4, 5, 1, 2, 3, 4, 5, 5, 6],
    "date_key":   [202511] * 5 + [202512] * 5 + [202512, 202512],
    "revenue":    [1.31, 1.92, 1.20, 1.55, 1.18, 1.29, 1.88, 1.25, 1.49,
                   0.71, 0.44, 0.09],
})
grain = fact_sales.duplicated(["branch_key", "date_key"], keep=False)
print("rows breaking the grain:")
print(fact_sales[grain].to_string(index=False))
orphan = ~fact_sales["branch_key"].isin(dim_branch["branch_key"])
print("rows with no matching branch:", fact_sales[orphan].index.tolist())
unused = ~dim_date["date_key"].isin(fact_sales["date_key"])
print("periods with no sales rows:", dim_date.loc[unused, "fiscal_period"].tolist())rows breaking the grain:
branch_key date_key revenue
5 202512 0.71
5 202512 0.44
rows with no matching branch: [11]
periods with no sales rows: ['2025-10']The test finds three problems. West has two rows for December 2025, breaking the one-row-per-branch-per-month grain. They might be two partial loads that should be combined, or one might be a duplicate; if the second is a duplicate, the dashboard would overstate West's December revenue by 0.44 million. One row has branch key 6, which does not exist in the branch dimension: perhaps a new branch not yet added, or a coding error. And October 2025 exists in the date dimension but has no sales rows at all, which suggests a failed data load. Each would produce a dashboard that looks perfectly normal and is wrong.
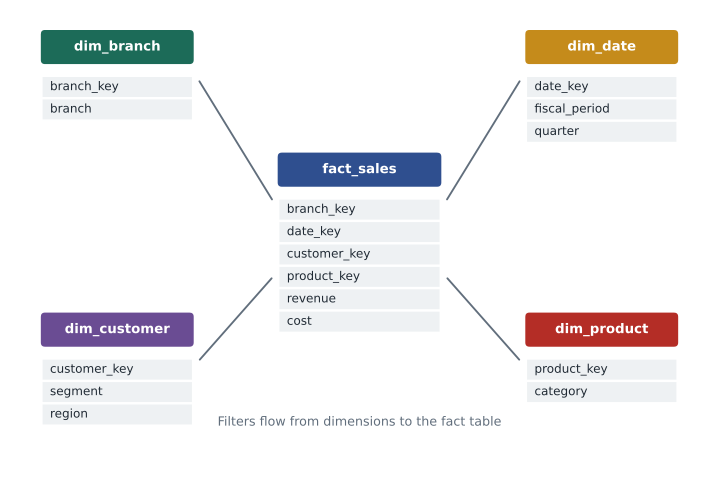
In Power BI, calculations are written as measures in the DAX language, such as Gross margin % = DIVIDE(SUM(Sales[Revenue]) - SUM(Sales[Cost]), SUM(Sales[Revenue])). A measure is calculated at whatever level the visual displays, so the margin for a region is computed from that region's summed revenue and cost, which is exactly the correct approach from lesson 4. Calculated columns, by contrast, are computed row by row and stored; averaging a margin column across rows gives the wrong answer for groups of different sizes.
Governance
Once a dashboard is published, people make decisions with it, so it needs the same controls as any other financial report. A few practices matter most.
- A single source of truth. Build dashboards from certified, shared data sets rather than personal extracts, so everyone sees the same numbers.
- Reconciliation. Agree dashboard totals to the general ledger each period, and show the refresh date and data source on the dashboard.
- Change control. Test changes to measures and data models before publishing, and keep a history of versions.
- Access control. Use row-level security so users see only the data they are entitled to, such as their own branch, and protect personal information.
- Ownership. Assign an owner for each dashboard and each KPI definition, responsible for accuracy and for retiring dashboards nobody uses.
Communicating a specific finding
Dashboards monitor; specific analyses explain and recommend. When Maya reports her margin findings to Daniel and the board, she will write a short memo with a few charts. Advice on business writing converges on a few principles. Lead with the answer: state the conclusion and recommendation first, then the supporting evidence, an approach sometimes called the pyramid principle after the consultant Barbara Minto. Structure the story as situation, complication and resolution: margins were stable, then West's fell sharply, and here is why and what to do. Quantify the impact in dollars. Say how confident you are and what is still uncertain. And put method and detail in an appendix for those who want it.
Worked problem
A one-paragraph executive summary
Draft the opening paragraph of Maya's memo to the board.
Show solution
- Lead with the finding: Cedarbrook's gross margin fell 1.3 points in 2025, about 1.1 million of gross profit, almost entirely in the West region.
- Give the cause: West cut fixture prices by about 11 per cent to win the Ridge Homes contract, and the lower prices spread to other West customers, costing about 0.79 million; higher purchase costs cost a further 0.25 million.
- Recommend: restore standard fixture pricing for customers other than Ridge Homes, review the Ridge contract at renewal, and add margin by customer to the monthly branch dashboard.
- State confidence and next steps: the price list history and contract terms confirm the pattern; finance will report the effect of the changes after one quarter.
Answer: Four sentences: finding with dollar impact, cause, recommendation, and confidence with follow-up.
The final step of the cycle, act and track, closes the loop. After the board acts, Maya's dashboard will show whether West's margin recovers. If it does not, the diagnosis was incomplete, and the cycle begins again.
Common mistakes
MistakePutting every available metric on one dashboard.
InsteadSelect a few KPIs tied to decisions, for one audience.
MistakeColouring every upward arrow green.
InsteadShow direction and whether it is good separately; a rising DSO is bad.
MistakeBuilding a dashboard on an untested data model.
InsteadCheck grain, keys and missing periods, and reconcile totals to the ledger.
MistakeLeaving KPI definitions to each user.
InsteadRecord definitions, sources, targets and tolerances in a KPI dictionary.
MistakeStarting a memo with the method.
InsteadLead with the answer and its dollar impact; put method in an appendix.
Summary and key terms
- A dashboard shows the most important information for an objective, readable at a glance.
- Strategic, operational and analytical dashboards serve different audiences and refresh rates.
- KPIs should be few, defined, tied to decisions and balanced between leading and lagging, financial and non-financial.
- Goodhart's law warns that targets distort behaviour; pair measures to reduce gaming.
- Status rules and tolerances should be explicit; direction and desirability are separate.
- Star schemas need a defined grain, valid keys and complete dimensions; test them before publishing.
- Dashboards need governance: single source of truth, reconciliation, change and access control, ownership.
- Memos should lead with the answer, quantify the impact and state confidence.
- Dashboard
- A visual display of the most important information for one or more objectives, monitored at a glance.
- Key performance indicator (KPI)
- A measure tied to an objective and used to monitor performance.
- Leading indicator
- A measure that signals future outcomes.
- Lagging indicator
- A measure that reports outcomes after they occur.
- Goodhart's law
- When a measure becomes a target, it tends to stop being a good measure.
- Star schema
- A data model with a central fact table linked to surrounding dimension tables.
- Fact table
- A table of measurements at a defined grain.
- Dimension table
- A table of descriptive attributes used to filter and group facts.
- Grain
- The level of detail represented by one row of a fact table.
- Row-level security
- Restricting which rows of data each user can see.
Practice problems
Work each problem on paper first, then reveal the answer to check.
Give one leading and one lagging indicator for Cedarbrook's sales.
Show answer
Leading: quotes issued or order backlog. Lagging: revenue or gross margin.
Why should a dashboard show revenue and margin together for branches?
Show answer
Revenue alone can be gamed with discounts; pairing it with margin reduces that risk.
In the KPI program, why is operating expense on watch rather than act?
Show answer
It is 0.4 points above target, within the 1.0 tolerance.
Change the DSO tolerance in the program to 5.0. What status results?
Show answer
Watch, because 44 is 4 days above the target of 40.
Why does the KPI program show "down+" for operating expenses?
Show answer
The ratio fell, and for expenses lower is better.
In the star schema program, what does branch key 6 indicate?
Show answer
A fact row with no matching branch dimension, such as a new branch not yet added or a coding error.
How much would West's December revenue be overstated if the second row is a duplicate?
Show answer
0.44 million.
Why should margin be a DAX measure rather than an averaged calculated column?
Show answer
A measure computes margin from summed revenue and cost at each level; averaging row margins is wrong for groups of different sizes.
Name three governance practices for published dashboards.
Show answer
Single source of truth, reconciliation to the ledger, change control, access control, ownership.
What is the pyramid principle?
Show answer
Lead with the conclusion, then give the supporting arguments and evidence.
Lesson quiz · 5 questions
Score 60% or more to complete this lesson.
Create a free account to save your progress, take quizzes and earn a certificate.