
ACCT-341 · Lesson 8 of 12 · 26 min
Visualization principles for accounting data
A good chart lets a reader see in seconds what a table would take minutes to reveal: a trend, an outlier, a comparison, a concentration. A bad chart hides the point, wastes the reader's attention or, worse, misleads. Accountants present numbers to boards, managers, lenders, auditors and regulators, and visualization is now an expected part of that work. This lesson covers the principles of effective, honest charts for accounting data: how people read charts, how to choose a chart for the question, how to design it so the message is clear, and how to avoid the distortions that undermine trust. Lesson 9 builds on these principles to design dashboards.
Two purposes: exploring and explaining
Charts serve two different purposes. Exploratory charts are for the analyst: quick, rough plots made to understand data, spot problems and find patterns. They can be ugly, and most are thrown away. Explanatory charts are for an audience: carefully designed to communicate one or two specific points to people who did not do the analysis. Many poor charts in business reports are exploratory charts presented as if they were explanatory, with default settings, no clear message and too much on them. Before designing a chart for others, write down the one sentence it should communicate, such as "West's margin fell because fixture prices were cut." If you cannot write that sentence, you are not ready to design the chart.
How people read charts
Research on graphical perception, starting with work by William Cleveland and Robert McGill in the 1980s, shows that people judge some visual encodings more accurately than others. Position along a common scale is read most accurately, followed by length, then angle and direction, then area, then colour intensity. This ranking explains several common recommendations. Bar charts and dot plots, which encode values as positions or lengths on a common axis, support accurate comparisons. Pie charts, which encode values as angles and areas, make it hard to compare slices of similar size. Bubble charts, which encode values as areas, are useful for showing rough magnitudes but not precise comparisons.
Some visual features are processed almost instantly, before conscious attention, and are called preattentive attributes: colour hue, intensity, size, position, orientation and enclosure, among others. A single red bar among grey bars is seen immediately. Designers use preattentive attributes to direct the eye to the important part of a chart and should avoid wasting them on decoration. If every bar is a different colour, none stands out.
Choosing a chart for the question
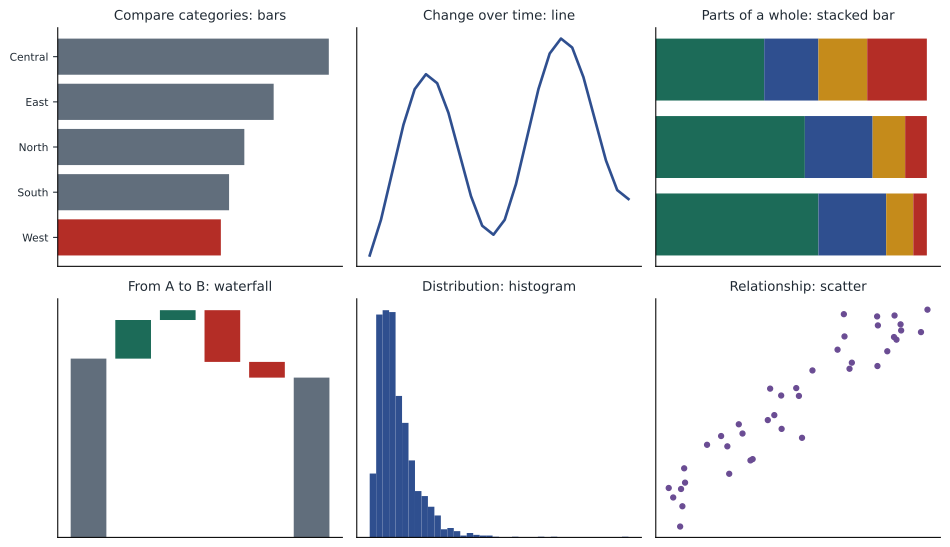
The right chart depends on the question the reader needs answered. Most accounting questions fall into a handful of types.
| Question | Good choices | Accounting example | Avoid |
|---|---|---|---|
| How do categories compare? | Bar chart (horizontal for long labels), dot plot | Revenue by branch | 3-D bars; pie charts with many slices |
| How has it changed over time? | Line chart; column chart for few periods | Monthly sales for two years | Lines for unordered categories |
| What makes up the whole? | Stacked bar, 100% stacked bar; a pie only for 2 or 3 parts | Receivables by aging bucket | Pies with many similar slices |
| How did we get from A to B? | Waterfall (bridge) chart | Budget to actual profit; gross profit change by effect | Separate unconnected bars |
| How are values distributed? | Histogram, box plot | Invoice amounts; days to pay | Bar chart of averages only |
| Are two measures related? | Scatter plot | Freight cost against shipment weight by branch | Dual-axis line charts |
| How do many units compare over time? | Small multiples: a grid of small identical charts | Monthly margin for each of five branches | One line chart with many tangled lines |
| What exactly are the numbers? | A well-formatted table | Trial balance; detailed variance schedule | A chart where precise values matter |
Tables remain the right choice when readers need to look up precise values or when there are many measures for each item. A chart is better when the point is a pattern, a comparison or an exception. Many good reports pair a chart that makes the point with a table that provides the detail.
Design principles
Once the chart type is chosen, design determines whether the message comes through. Edward Tufte's idea of maximizing the data-ink ratio, the share of a graphic's ink devoted to the data, is a useful starting point: remove anything that does not help the reader understand the data. In practice, a few principles cover most situations.
- Lead with the message. Use the title to state the finding, such as "West margin fell 6.6 points; the other regions held steady," rather than a label such as "Gross margin by region."
- Remove clutter. Delete heavy gridlines, borders, background shading, 3-D effects and redundant legends. Light gridlines or none at all usually work best.
- Label directly. Put labels next to lines and bars instead of in a legend the reader must match by colour. Label values where precision matters.
- Use colour sparingly and with purpose. Show most data in a neutral colour and use one accent colour for the point of the chart. Use colour consistently across charts, so the West region is always the same colour.
- Order categories meaningfully. Sort bars by value unless the categories have a natural order, such as months or aging buckets.
- Keep scales honest and consistent. Start bar charts at zero, use the same scale on charts meant to be compared, and say when a scale is logarithmic.
- Format numbers for the reader. Round to the precision that matters, use thousands separators, and state units, such as millions of dollars, once in the title or axis.
Accessibility is part of good design, not an extra. About 8 per cent of men and 0.5 per cent of women of northern European descent have some form of colour vision deficiency, most often difficulty distinguishing red from green. Never rely on colour alone to carry meaning: use labels, patterns or position as well, and prefer palettes designed to be distinguishable by people with colour vision deficiency, such as blue and orange rather than red and green. Make sure text and lines have enough contrast against the background, and provide a text description of the key finding for readers using screen readers.
Some organizations adopt a formal notation for business charts. The International Business Communication Standards (IBCS), for example, recommend consistent visual conventions: actual figures in solid dark fill, plans and budgets as outlines, forecasts hatched, previous years in grey, and positive and negative variances in consistent colours. Whether or not a company adopts IBCS, consistent notation across all its reports helps readers, because they learn the conventions once.
Honest charts
Charts can mislead without containing a single false number. Because accountants' credibility depends on fair presentation, it is worth knowing the common distortions well enough to avoid them and to spot them in others' work.
| Distortion | How it misleads | Honest alternative |
|---|---|---|
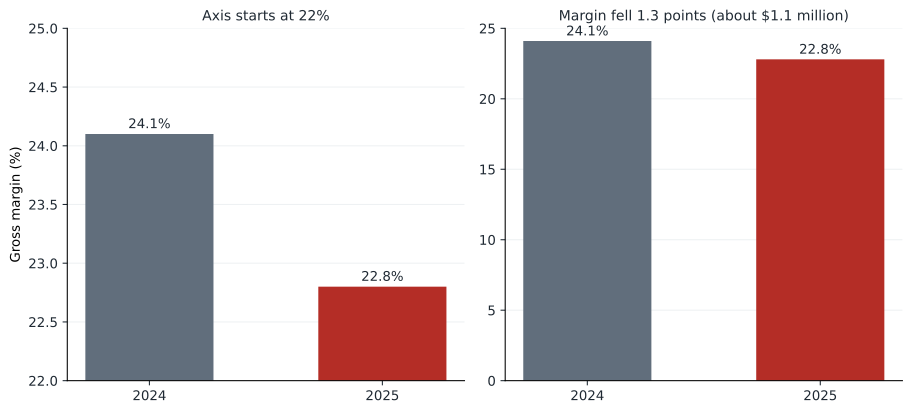
| Truncated bar axis | Bars start above zero, exaggerating differences | Start bars at zero; use a dot plot or line if small differences matter |
| Dual axes | Two scales can be set to make any two series look related | Two aligned charts, or index both series to 100 |
| Cherry-picked periods | Choosing start and end dates to show a desired trend | Show a full, relevant period and state why it was chosen |
| 3-D effects | Perspective distorts lengths and areas | Flat, two-dimensional charts |
| Area scaled by height | Doubling an icon's height quadruples its area | Scale lengths, or areas proportionally |
| Inconsistent scales | Side-by-side charts with different axes look comparable but are not | Share axes across small multiples |
| Omitted context | A rising cost without the rising activity behind it | Show ratios or drivers alongside totals |
Tufte proposed the lie factor to measure distortion: the size of an effect as shown in the graphic divided by the size of the effect in the data. A lie factor of 1 is honest. The program below computes it for a bar chart comparing Cedarbrook's gross margin in 2024 and 2025 with the vertical axis starting at different values.
# How much does a truncated axis exaggerate a difference?
def lie_factor(a, b, axis_start):
    data_change = (b - a) / a                       # change in the data
    shown_a, shown_b = a - axis_start, b - axis_start
    visual_change = (shown_b - shown_a) / shown_a   # change in bar length
    return data_change, visual_change, visual_change / data_change
for start in (0, 15, 20, 22):
    d, v, lf = lie_factor(22.8, 24.1, start)       # margin, 2025 vs 2024
    print(f"axis starts at {start:>2}%: data differ by {d:.1%}, "
f"bars differ by {v:.0%}, lie factor {lf:.1f}")axis starts at 0%: data differ by 5.7%, bars differ by 6%, lie factor 1.0 axis starts at 15%: data differ by 5.7%, bars differ by 17%, lie factor 2.9 axis starts at 20%: data differ by 5.7%, bars differ by 46%, lie factor 8.1 axis starts at 22%: data differ by 5.7%, bars differ by 162%, lie factor 28.5
The margins differ by 5.7 per cent of the 2024 value, from 22.8 to 24.1. With the axis starting at zero, the bars differ by the same proportion and the lie factor is 1. Starting the axis at 20 per cent makes one bar look nearly half as long again as the other, a lie factor of 8. Starting at 22 per cent makes the 2024 bar look more than two and a half times as long. A board member glancing at that chart would believe margins had collapsed. The point is not that small changes should be hidden: a 1.3-point margin decline is worth a million dollars and deserves attention. The point is to show it honestly, for example with a line chart whose axis is clearly labelled, or by charting the change itself, or by stating the dollar impact in the title.
Line charts are different from bar charts in this respect. A line chart encodes values by position, not length, so its axis does not have to start at zero, and starting at zero can flatten meaningful variation into a straight line. The rule is to choose an axis range that shows the variation fairly and to label it clearly.
Charts accountants use
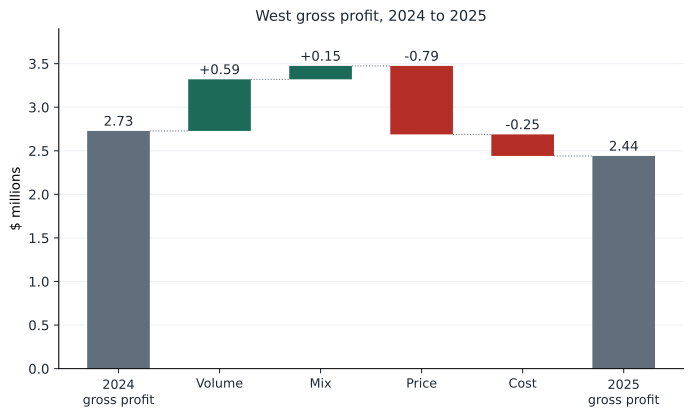
A few chart types are particularly useful in accounting work. The waterfall or bridge chart shows how a starting total becomes an ending total through a series of positive and negative steps. It is the natural way to present a budget-to-actual reconciliation, a year-over-year profit bridge, or the price, volume, mix and cost decomposition from lesson 7. Floating bars show each step, rising for increases and falling for decreases, with the totals anchored at zero. The program below computes the bar positions for West's gross profit bridge, which any charting tool can then draw.
# Positions for a waterfall (bridge) chart of West gross profit, $ millions
steps = [("2024 gross profit", 2.728, "total"), ("Volume", 0.592, "step"),
         ("Mix", 0.154, "step"), ("Price", -0.786, "step"),
         ("Cost", -0.247, "step"), ("2025 gross profit", None, "total")]
level = 0.0
print(f"{'bar':<18}{'bottom':>8}{'top':>7}  color")
for name, value, kind in steps:
    if kind == "total":
        value = level if value is None else value
        bottom, top, color = 0.0, value, "neutral"
        level = value
    else:
        bottom, top = sorted((level, level + value))
        color = "green" if value > 0 else "red"
        level += value
print(f"{name:<18}{bottom:>8.2f}{top:>7.2f} {color}")bar bottom top color 2024 gross profit 0.00 2.73 neutral Volume 2.73 3.32 green Mix 3.32 3.47 green Price 2.69 3.47 red Cost 2.44 2.69 red 2025 gross profit 0.00 2.44 neutral
Each step bar floats between the running level before and after the step; increases are green and decreases red, and the two totals start at zero. Read from left to right, the chart tells the story of lesson 7 at a glance: volume and mix pushed gross profit up to 3.47 million, and price and cost pulled it down to 2.44 million. Current versions of Excel and Power BI include a built-in waterfall chart type, so in practice you would supply the steps and let the tool compute the positions, but knowing how the positions are calculated helps when a tool's defaults are wrong, for example when it fails to treat the last bar as a total.
Other useful types include small multiples, which show the same chart for each branch or product line in a grid with shared axes, making comparisons across units easy; sparklines, tiny word-sized line charts placed next to figures in a table to show their recent trend; and bullet charts, which compare an actual value with a target and qualitative ranges in a compact bar, a space-efficient alternative to dials and gauges on dashboards.
Charts in spreadsheets and BI tools
Excel, Power BI and Tableau all produce good charts, but their defaults are designed to be generic rather than clear. A practical workflow is to choose the chart type deliberately, then change the defaults: delete the legend and label series directly, lighten or remove gridlines, set axis ranges and number formats, replace the default colours with a neutral colour plus one accent, and rewrite the title as a message. Saving a chart template, or a theme in Power BI, applies these choices consistently across reports. In Python, the matplotlib library used for the figures in this course gives full control over every element at the cost of more code.
Common mistakes
MistakeUsing the default chart title, such as "Sales by region".
InsteadState the finding in the title.
MistakeStarting a bar chart's axis above zero to make a change visible.
InsteadStart bars at zero; show small changes with a line chart, a chart of the change itself, or the dollar impact.
MistakeUsing a pie chart to compare many similar categories.
InsteadUse a sorted bar chart.
MistakeDistinguishing series only by red and green.
InsteadUse colour-blind-safe palettes and direct labels.
MistakeShowing a profit reconciliation as unconnected bars.
InsteadUse a waterfall chart that anchors totals at zero and floats the steps.
Summary and key terms
- Exploratory charts help the analyst; explanatory charts communicate one clear message to an audience.
- Position and length are read most accurately; angle, area and colour intensity less so.
- Choose the chart for the question: bars for comparison, lines for trends, waterfalls for bridges, histograms for distributions, scatter plots for relationships.
- State the message in the title, remove clutter, label directly and use colour sparingly and consistently.
- Design for accessibility: never rely on colour alone, and use colour-blind-safe palettes.
- Bar charts must start at zero; the lie factor measures how much a graphic exaggerates the data.
- Waterfall charts, small multiples, sparklines and bullet charts are especially useful in accounting.
- Explanatory chart
- A chart designed to communicate a specific message to an audience.
- Preattentive attribute
- A visual feature, such as colour or size, perceived almost instantly.
- Data-ink ratio
- The share of a graphic's ink used to display data rather than decoration.
- Lie factor
- The size of an effect shown in a graphic divided by its size in the data.
- Waterfall chart
- A chart showing how a starting value becomes an ending value through positive and negative steps.
- Small multiples
- A grid of small charts with the same design and axes, one per category.
- Sparkline
- A small, word-sized line chart showing a trend.
- Bullet chart
- A compact bar comparing a measure with a target and qualitative ranges.
- Dual-axis chart
- A chart with two vertical scales, prone to suggesting false relationships.
- IBCS
- International Business Communication Standards, a notation for business reports and charts.
Practice problems
Work each problem on paper first, then reveal the answer to check.
What one sentence might an explanatory chart of the West margin analysis communicate?
Show answer
For example: West's margin fell 6.6 points because fixture prices were cut, while other regions held steady.
Why are bar charts preferred to pie charts for comparing branch revenues?
Show answer
People judge lengths on a common scale more accurately than angles and areas.
Which chart best shows how budgeted operating profit became actual operating profit?
Show answer
A waterfall (bridge) chart.
In the lie factor program, what is the lie factor when the axis starts at 15 per cent?
Show answer
About 2.9.
Add an axis start of 10 per cent to the program. What lie factor results?
Show answer
About 1.8.
Why can a line chart's axis start above zero?
Show answer
Lines encode values by position, not length, so the axis can be set to show variation fairly if clearly labelled.
In the waterfall program, between which values does the price bar float?
Show answer
Between 2.69 and 3.47 million.
Change the mix effect in the waterfall program to -0.154. What is the new ending total?
Show answer
About 2.13 million.
Give two ways to make a chart accessible to readers with colour vision deficiency.
Show answer
Use direct labels or patterns, and a colour-blind-safe palette such as blue and orange.
What chart type would you use to compare monthly margins of five branches?
Show answer
Small multiples with shared axes.
Lesson quiz · 5 questions
Score 60% or more to complete this lesson.
Create a free account to save your progress, take quizzes and earn a certificate.