
ACCT-341 · Lesson 11 of 12 · 30 min
Analytics in audit: risk assessment, testing and anomaly detection
Auditing is where data analytics has changed accounting practice most visibly. For most of the twentieth century, auditors could examine only a small sample of transactions, because each one had to be pulled and checked by hand. Today an auditor can obtain a complete copy of a client's general ledger and subledgers and test every transaction against a rule in minutes. This lesson explains how analytics fits into an audit under the standards, then works through four techniques: substantive analytical procedures built on a driver model, full-population tests of payments, Benford's law, and journal entry testing. It closes with the practical and professional issues of using client data and handling large numbers of exceptions. The same techniques serve internal auditors and fraud examiners, and many apply to tax compliance reviews.
Audit data analytics
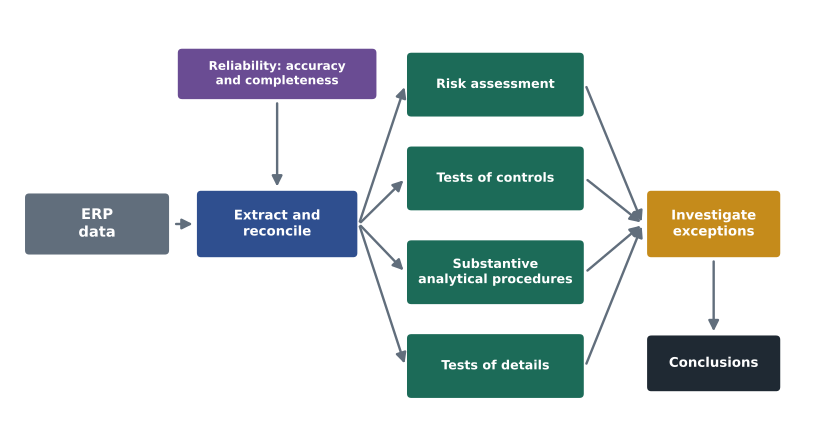
The AICPA's Guide to Audit Data Analytics, published in 2017, describes audit data analytics as the science and art of discovering and analysing patterns, identifying anomalies and extracting other useful information from data underlying or related to the subject matter of an audit, through analysis, modelling and visualization, for the purpose of planning or performing the audit. The definition is broad on purpose: analytics can support almost every phase of an audit.
| Audit phase | Analytics use | Cedarbrook example |
|---|---|---|
| Risk assessment | Identify unusual trends, relationships and transactions that point to risks of material misstatement | West margin decline; December freight; manual entry patterns |
| Tests of controls | Test a control on every transaction rather than a sample | Every payment of 5,000 or more approved by the controller |
| Substantive analytical procedures | Compare recorded amounts with an independent expectation | Freight expectation from shipments and fuel |
| Tests of details | Test every item against a rule, then investigate exceptions | Three-way match on all purchases; revenue cut-off on all invoices |
| Fraud procedures | Select journal entries and transactions with fraud risk characteristics | Self-approved, weekend and round manual entries |
| Completion | Overall review of the financial statements for consistency with the auditor's understanding | Final ratio and trend review by branch |
Canadian Auditing Standards are largely technology-neutral, but several address analytics directly or indirectly. CAS 315, revised for periods beginning on or after December 15, 2021, recognizes that auditors may use automated tools and techniques in risk assessment, and requires an understanding of the entity's IT environment. CAS 520 governs analytical procedures, CAS 330 the design of responses to assessed risks, and CAS 240 requires testing of journal entries for management override. CAS 500 requires the auditor to evaluate whether information produced by the entity is sufficiently reliable, including its accuracy and completeness. As of late 2026, the IAASB's project to revise ISA 500 to address technology and the attributes of reliable information was still in progress; because the AASB generally adopts revised ISAs as CASs, auditors should check the current status before relying on any revised requirements. CPA Canada and the AASB have also issued non-authoritative guidance on using data analytics in audits.
Reliable data first
Every audit analytic rests on the data. Before using client data, the auditor must obtain evidence that it is complete and accurate, as lesson 2 described: reconciling the extract to the general ledger and trial balance, understanding how it was produced, and testing the IT general controls over the system that produced it, or otherwise testing the data directly. Auditors prefer to obtain data directly from the system, or to observe the extraction, rather than accept a file prepared by client staff. A beautiful analysis of incomplete data gives false assurance, which is worse than no analysis at all.
Substantive analytical procedures
A substantive analytical procedure compares a recorded amount with the auditor's expectation of what it should be. To provide substantive evidence, the procedure must be designed carefully. The auditor develops an expectation precise enough to detect a misstatement that could be material, usually from independent or tested data and plausible relationships; sets a threshold for the difference that can be accepted without further investigation, before seeing the result; compares the expectation with the recorded amount; and investigates differences above the threshold by obtaining corroborating evidence, not merely management's explanation.
Halden Rowe, Cedarbrook's auditor, uses the driver model from lesson 10 to test December 2025 freight expense. This time the model is fitted on January 2024 to November 2025 only, so that the month under test does not influence its own expectation. The audit senior sets the threshold at 12 thousand, based on performance materiality for the account, before running the comparison.
# A substantive analytical procedure for December 2025 freight
import numpy as np
shipments = np.array([3120, 2980, 3410, 3890, 4420, 4710, 4650, 4580, 4300,
                      3950, 3380, 3050, 3200, 3090, 3520, 4010, 4560, 4840,
                      4790, 4700, 4410, 4060, 3460, 3140])
fuel = np.array([100, 101, 103, 104, 106, 108, 107, 105, 104, 102, 101, 100,
                 99, 100, 102, 105, 107, 109, 110, 108, 106, 104, 103, 102])
freight = np.array([181, 175, 199, 228, 262, 282, 277, 270, 252, 230, 197,
                    178, 185, 179, 205, 236, 270, 291, 290, 283, 264, 241,
                    203, 213])                       # $ thousands, recorded
X = np.column_stack([np.ones(24), shipments, fuel])
coef, *_ = np.linalg.lstsq(X[:23], freight[:23], rcond=None)  # fit Jan24-Nov25
expected = X[23] @ coef
threshold = 12.0                 # set by the auditor before seeing the result
diff = freight[23] - expected
print(f"expected December freight {expected:.1f}, recorded {freight[23]}")
print(f"difference {diff:+.1f} against a threshold of {threshold}")
print("investigate the difference" if abs(diff) > threshold
else "no further work: within threshold")expected December freight 184.3, recorded 213 difference +28.7 against a threshold of 12.0 investigate the difference
Fitted without December's own data, the model expects December freight of about 184 thousand, so the recorded 213 thousand exceeds the expectation by about 29 thousand, well above the threshold. Note that the difference is larger than the residual of 23 thousand found in lesson 10, because the outlier is no longer pulling the fitted line toward itself. The auditor must now investigate: obtain the December freight invoices and accruals, compare them with carrier statements and shipping records, and determine whether the difference reflects a misstatement. Management's explanation alone is not enough; it must be corroborated.
Full-population tests
Analytics lets the auditor test every item in a population against a rule. Common examples include matching every purchase invoice to a purchase order and receiving record, testing every sales invoice around year end for cut-off, recalculating every depreciation charge, and checking every payment for proper approval. The program below runs two tests across Cedarbrook's June 2025 payments: payments that may have been split to stay under the 5,000 approval limit, and payments made shortly after a vendor's bank details were changed, a common sign of payment diversion fraud.
# Full-population tests on payments: split invoices and bank detail changes
import pandas as pd
pay = pd.DataFrame({
    "pay_id":  range(1, 11),
    "vendor":  ["V0417", "V0982", "V1312", "V1312", "V1312", "V0640",
                "V0640", "V2208", "V1133", "V2208"],
    "date":    pd.to_datetime(["2025-06-02", "2025-06-02", "2025-06-03",
                "2025-06-03", "2025-06-03", "2025-06-05", "2025-06-12",
                "2025-06-16", "2025-06-16", "2025-06-30"]),
    "amount":  [1250.00, 8200.00, 4900.00, 4750.00, 4980.00, 2300.00,
                2310.00, 3400.00, 6120.00, 9800.00],
    "approved_by": ["jli", "dreyes", "tpatel", "tpatel", "tpatel", "jli",
                    "jli", "tpatel", "dreyes", "tpatel"],
})
limit = 5000                    # payments of 5,000 or more need the controller
same_day = pay.groupby(["vendor", "date"]).agg(
    n=("pay_id", "size"), total=("amount", "sum"), largest=("amount", "max"))
split = same_day[(same_day["n"] > 1) & (same_day["largest"] < limit)
                 & (same_day["total"] >= limit)]
print("possible split payments:")
print(split.to_string())
changes = pd.DataFrame({"vendor": ["V2208", "V0640"],
    "changed_on": pd.to_datetime(["2025-06-13", "2025-01-20"]),
    "changed_by": ["tpatel", "mokafor"]})
m = pay.merge(changes, on="vendor")
recent = m[(m["date"] >= m["changed_on"])
           & (m["date"] - m["changed_on"] <= pd.Timedelta(days=30))]
print("payments within 30 days after a bank detail change:")
print(recent[["pay_id", "vendor", "date", "amount", "changed_by",
"approved_by"]].to_string(index=False))possible split payments:
n total largest
vendor date
V1312 2025-06-03 3 14630.0 4980.0
payments within 30 days after a bank detail change:
pay_id vendor date amount changed_by approved_by
8 V2208 2025-06-16 3400.0 tpatel tpatel
10 V2208 2025-06-30 9800.0 tpatel tpatelThe first test finds three payments to vendor V1312 on the same day, each just under the 5,000 limit, totalling 14,630, all approved by the same person. That pattern is consistent with splitting a payment to avoid the controller's approval. The second test finds two payments to V2208 shortly after its bank details were changed, and the change, the approval of both payments and the processing were all done by the same user. Payment 10, for 9,800, also exceeds the approval limit without the controller's approval, which is a control failure in its own right. None of this proves wrongdoing: there may be legitimate explanations, and an analyst should be careful not to treat a user name as a suspect. But together these are exactly the patterns that call for prompt follow-up with supporting documents, and, given the overlap with the manual entry patterns in lesson 6, a discussion with those charged with governance about whether a broader investigation is needed.
Testing the whole population changes the nature of the evidence but does not remove the need for judgment. There is no sampling risk, because nothing was left untested against the rule, but the test is only as good as the rule and the data. A three-way match on every invoice confirms that documents agree with each other; it does not confirm that the goods were needed or that prices were fair. And full-population tests often produce many exceptions, which brings us to their treatment below.
Benford's law
In many naturally occurring sets of numbers, the leading digit is far more often 1 than 9. Benford's law predicts that the proportion of numbers with first digit d is log10(1 + 1/d), about 30.1 per cent for 1, 17.6 per cent for 2, and falling to 4.6 per cent for 9. The pattern appears in data that span several orders of magnitude and arise from combining or multiplying quantities, which describes many accounting populations such as invoice amounts and payments. ACCT-240 introduced the idea; here we add a measure of conformity.
Mark Nigrini, who popularized Benford's law in auditing, proposed the mean absolute deviation (MAD) between observed and expected proportions as a measure of conformity, with suggested thresholds for the first-digit test of up to 0.006 for close conformity, 0.006 to 0.012 for acceptable conformity, 0.012 to 0.015 for marginally acceptable conformity, and above 0.015 for nonconformity. The program applies the test to simulated vendor invoices, first as genuine data, then with 600 invoices added just under a 5,000 approval limit.
# First-digit Benford test on vendor invoices, with a conformity measure
import numpy as np
rng = np.random.default_rng(2025)
genuine = np.round(rng.lognormal(7.0, 1.3, 9_400), 2)
just_under = np.round(rng.uniform(4_500, 4_999.99, 600), 2)  # below a 5,000 limit
for label, amounts in [("genuine invoices only", genuine),
                       ("with 600 invoices just under 5,000",
                        np.concatenate([genuine, just_under]))]:
    first = np.array([int(f"{a:e}"[0]) for a in amounts])
    observed = np.array([(first == d).mean() for d in range(1, 10)])
    expected = np.log10(1 + 1 / np.arange(1, 10))
    mad = np.abs(observed - expected).mean()
    verdict = ("close conformity" if mad <= 0.006 else "acceptable" if mad <= 0.012
               else "marginal" if mad <= 0.015 else "nonconformity")
    print(f"{label}: MAD {mad:.4f} ({verdict})")
    print("  digit    " + "".join(f"{d:>6}" for d in range(1, 10)))
    print("  expected " + "".join(f"{e:>6.3f}" for e in expected))
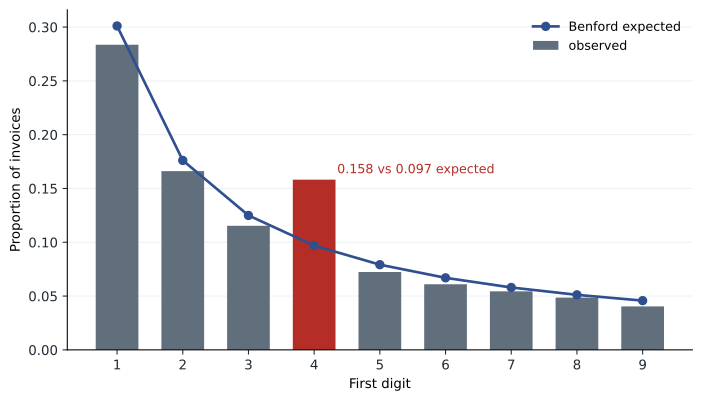
print(" observed " + "".join(f"{o:>6.3f}" for o in observed))genuine invoices only: MAD 0.0021 (close conformity) digit 1 2 3 4 5 6 7 8 9 expected 0.301 0.176 0.125 0.097 0.079 0.067 0.058 0.051 0.046 observed 0.302 0.177 0.123 0.104 0.077 0.065 0.058 0.052 0.043 with 600 invoices just under 5,000: MAD 0.0136 (marginal) digit 1 2 3 4 5 6 7 8 9 expected 0.301 0.176 0.125 0.097 0.079 0.067 0.058 0.051 0.046 observed 0.284 0.166 0.115 0.158 0.072 0.061 0.054 0.049 0.040
The genuine invoices conform closely, with a MAD of 0.0021. Adding the 600 invoices just under 5,000 raises the share of amounts starting with 4 from about 10 to 16 per cent and pushes the MAD to 0.0136, marginal conformity. The digit-level detail is more informative than the overall verdict: the spike at 4 points directly to amounts just below the 5,000 limit, which can then be examined with the split-payment test above.
Benford analysis is a screening tool, not proof. Many legitimate populations do not follow Benford's law: amounts with a built-in minimum or maximum, prices set at psychological points such as 99, populations of similar-sized items such as monthly rent, and assigned numbers such as invoice numbers. It works best on large populations of transaction amounts that span several orders of magnitude, and its results direct attention to particular digits or digit combinations for follow-up.
Journal entry testing
CAS 240 requires the auditor, in every audit, to design and perform procedures to test the appropriateness of journal entries recorded in the general ledger and other adjustments made in preparing the financial statements, because management is in a unique position to commit fraud by overriding controls. The auditor makes inquiries about inappropriate or unusual activity, selects entries made at the end of the reporting period, and considers the need to test entries throughout the period. Analytics makes this practical: the auditor obtains the complete journal entry population, reconciles it to the trial balance, and uses exception queries like those in lesson 6 to select entries with fraud risk characteristics.
The characteristics auditors look for are those in lesson 6: entries to unrelated, unusual or seldom-used accounts; entries by individuals who do not normally make entries; entries recorded at period end or after the close with little or no explanation; entries made before or during preparation of the financial statements without account numbers; round numbers or consistent ending digits; and entries affecting accounts with complex estimates. The auditor tests selected entries by examining support and confirming that they were properly authorized and recorded.
Worked problem
Selecting entries at Cedarbrook
Halden Rowe has Cedarbrook's complete 2025 journal entry population, reconciled to the trial balance. The manual entry exception query from lesson 6 returned fifteen entries with two or more risk indicators. How should the audit team use this result?
Show solution
- Confirm the population is complete: the reconciliation to the trial balance and the sequence gap test from lesson 6.
- Test all entries with the highest-risk characteristics, here the two self-approved entries, and all period-end manual entries above a threshold.
- Examine the pattern of weekend round entries by one user as a group: obtain support and ask the user and the controller about it.
- Consider whether the self-approvals indicate a deficiency in internal control over journal entries, to be communicated to management and those charged with governance.
- Document the population, the criteria, the selections, the results and the conclusions.
Answer: Use the analytics to target testing on the riskiest entries and patterns, test them against support, and evaluate control implications.
Handling exceptions
Full-population tests and exception queries often produce more exceptions than an auditor can examine one by one. Simply sampling from the exceptions is generally not appropriate, because each exception is an item that failed a test designed to find misstatements. Guidance in this area recommends a structured approach. First, refine the test if exceptions reveal that the rule was too broad, documenting the reason. Second, group exceptions with similar characteristics, investigate the cause of each group, and decide whether the group represents misstatements, control deficiencies or false positives. Third, evaluate any misstatements found, project them where appropriate, and consider their effect on the risk assessment and the rest of the audit.
| Step | What the auditor does | Example |
|---|---|---|
| Refine | Adjust the rule when exceptions are clearly not relevant, and document why | Exclude system-generated reversing entries that are automatically balanced |
| Group | Cluster exceptions by common cause | All period 13 entries by the controller |
| Investigate | Determine the cause of each group with evidence | Examine support for a representative set and inquire |
| Evaluate | Classify as misstatement, control deficiency or false positive | Self-approval is a control deficiency even if entries are correct |
| Respond | Adjust the audit plan and communicate findings | Extend testing; report deficiencies to governance |
Practical and professional issues
Several issues recur in practice. Data access and security: client data often contain personal and confidential information, so auditors must transfer and store it securely, keep only what they need and dispose of it according to policy. Independence: building or maintaining a client's analytics systems could create a self-review threat, so audit firms must be careful about providing analytics services to audit clients. Tool reliability: the auditor must be satisfied that the software and scripts used work correctly, which firms address through testing and controls over audit tools. Documentation: the audit file must record the data, the procedures, the parameters, the results and how exceptions were resolved, so another auditor could understand and reproduce the work. And skepticism: analytics finds patterns; auditors must still ask whether the data could be manipulated and whether the explanation fits all the evidence.
Analytics also supports tax work, such as testing sales tax coding on every invoice, matching expense claims to policy, and reconciling payroll to tax filings, and internal audit, where continuous monitoring of payments, vendor changes and journal entries can detect problems as they arise rather than months later.
Common mistakes
MistakeRunning analytics on client data before establishing that it is complete and accurate.
InsteadReconcile to the trial balance, understand the extraction and test relevant controls first.
MistakeSetting a substantive analytical procedure's threshold after seeing the difference.
InsteadSet the threshold in advance, based on materiality and the risk.
MistakeAccepting management's explanation of a large difference without evidence.
InsteadCorroborate explanations with documents or independent data.
MistakeSampling from a large set of exceptions.
InsteadRefine, group, investigate causes and evaluate each group.
MistakeTreating a Benford deviation or a user's repeated appearance in exceptions as proof of fraud.
InsteadTreat them as leads for follow-up with supporting evidence.
Summary and key terms
- Audit data analytics supports risk assessment, tests of controls, substantive analytical procedures, tests of details and fraud procedures.
- CAS 315, 330, 500, 520 and 240 frame the use of analytics; the IAASB's ISA 500 revision was still in progress in late 2026.
- Reliable data, reconciled and understood, come before any audit analytic.
- Substantive analytical procedures need a precise expectation, a threshold set in advance and corroborated investigation.
- Full-population tests remove sampling risk but not the need for judgment about rules, data and exceptions.
- Benford's law screens transaction amounts; Nigrini's MAD measures conformity; deviations are leads.
- Journal entry testing uses analytics to select entries with fraud risk characteristics from the complete population.
- Exceptions should be refined, grouped, investigated and evaluated rather than sampled.
- Information produced by the entity
- Information created by the entity's systems and used as audit evidence, whose reliability the auditor must evaluate.
- Audit data analytics
- Analysing data underlying an audit to discover patterns and anomalies for planning or performing the audit.
- Substantive analytical procedure
- Comparing a recorded amount with an independent expectation to obtain substantive evidence.
- Expectation
- The auditor's estimate of what a recorded amount should be.
- Threshold
- The difference from the expectation that can be accepted without further investigation.
- Full-population testing
- Testing every item in a population against a rule.
- Split payment
- Dividing a payment into smaller amounts to avoid an approval limit.
- Benford's law
- The expected distribution of leading digits in many naturally occurring data sets.
- Mean absolute deviation (MAD)
- The average absolute difference between observed and expected proportions.
- Management override
- Management circumventing controls to record inappropriate entries.
Practice problems
Work each problem on paper first, then reveal the answer to check.
Name three phases of an audit where analytics can be used.
Show answer
Risk assessment, tests of controls, substantive analytical procedures, tests of details, fraud procedures or completion.
Why was the freight model refitted without December 2025 for the audit procedure?
Show answer
So the month under test does not influence its own expectation.
What was the difference between recorded and expected December freight, and was it above the threshold?
Show answer
About 28.7 thousand, above the 12 thousand threshold.
Change the threshold in the audit program to 30. What conclusion follows?
Show answer
No further work, because 28.7 is within 30, which shows why the threshold must be set carefully in advance.
What pattern did the split-payment test find?
Show answer
Three same-day payments to V1312, each under 5,000, totalling 14,630, approved by one person.
Why is a payment soon after a bank detail change a risk?
Show answer
Fraudsters change vendor bank details to divert payments.
What share of numbers starts with 1 under Benford's law?
Show answer
About 30.1 per cent.
In the Benford program, which digit shows the spike and why?
Show answer
Digit 4, because 600 invoices were just under 5,000.
Give two kinds of populations that should not be expected to follow Benford's law.
Show answer
Amounts with fixed limits or psychological prices, similar-sized items such as rent, or assigned numbers.
Why should auditors not simply sample from 2,000 exceptions?
Show answer
Each exception failed a test designed to find misstatement; they should be refined, grouped, investigated and evaluated.
Lesson quiz · 5 questions
Score 60% or more to complete this lesson.
Create a free account to save your progress, take quizzes and earn a certificate.