
ACCT-341 · Lesson 4 of 12 · 28 min
Preparing data II: joining, reshaping and aggregating
Clean data are rarely in the shape an analysis needs. Invoices sit in one table and customers in another; a budget arrives with months across the columns while actual results arrive with one row per transaction; the question is about regions and quarters while the data are by invoice line and day. This lesson covers the three transformations that bridge that gap: joining tables, reshaping between wide and long layouts, and aggregating to the right level. Each is simple in principle, and each is a common source of serious errors that produce a confident, wrong answer without any warning.
Tidy data
A useful target for prepared data is the tidy layout, a term popularized by the statistician Hadley Wickham. In a tidy table, each variable is a column, each observation is a row, and each type of observational unit is its own table. A sales table with one row per invoice line and columns for date, customer, item, quantity and amount is tidy. A report with months across the top and a subtotal row after every region is not, although it may be exactly right for people to read.
Tidy data are easy to filter, group, join and chart, because every tool expects one fact per row. Most data preparation consists of turning untidy inputs into tidy tables, analysing those, and only at the end turning results back into a human-friendly layout. Keeping these two purposes separate, data for machines and reports for people, avoids a great deal of trouble.
Joining tables
A join combines rows from two tables based on matching values in one or more key columns. Joining invoices to the customer master on customer number, for example, adds each customer's name and region to every invoice. Different kinds of join treat unmatched rows differently, and choosing the wrong one silently drops or adds records.
| Join | Keeps | Accounting use |
|---|---|---|
| Inner join | Only rows with a match in both tables | Invoices with valid customers; unmatched rows disappear without warning |
| Left join | All rows of the left table; matching rows from the right, blanks where none | Enrich every invoice with customer data while keeping invoices with no customer |
| Right join | All rows of the right table | The mirror image of a left join; rarely needed |
| Full outer join | All rows from both tables | Reconciling two systems: shows items in either but not both |
| Anti join | Rows of the left table with no match in the right | Exceptions: invoices with no customer record, payments with no approved invoice |
| Semi join | Rows of the left table that have a match, without adding columns | Filtering: invoices for customers on a watch list |
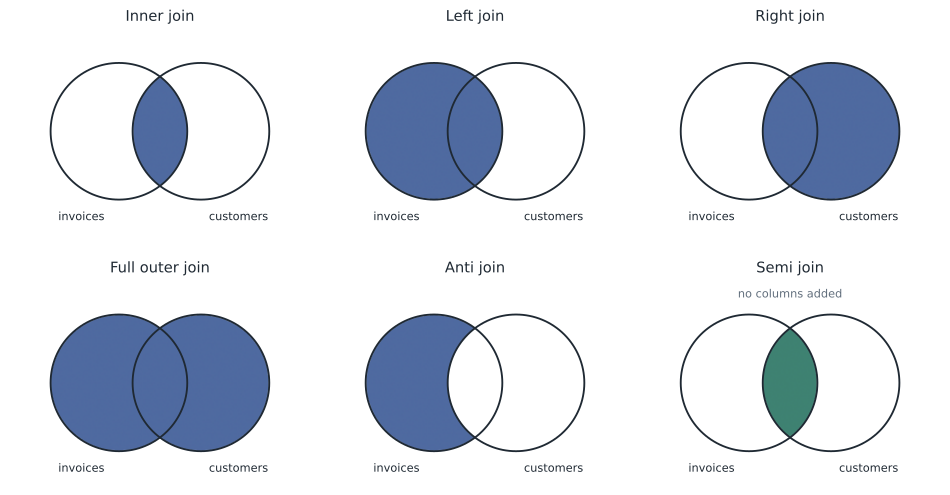
For an accountant, the anti join is often the most valuable. Many controls are rules of the form "every A must have a matching B": every payment must have an approved invoice, every invoice must have a shipment, every employee paid must be on the active employee list. An anti join lists every A without a B, which is exactly the exception report a control tester wants.
Keys and cardinality
The relationship between two tables on a key is described by its cardinality. In a one-to-one relationship, each key appears at most once in each table. In a one-to-many relationship, such as customers to invoices, each key appears once in one table and possibly many times in the other. In a many-to-many relationship, keys repeat in both tables. Joining in a many-to-many relationship multiplies rows: two invoices for a customer joined to two contacts for that customer produce four rows.
Before joining, check the key in each table. Is it unique where it should be? Are there blank keys? Do the keys have the same type and format on both sides, for example text "00417" in one table and the number 417 in the other? Many tools can enforce the expected cardinality: in pandas the validate argument raises an error if the right table is not unique on the key, and in SQL you can count keys with GROUP BY and HAVING before you join.
A join with exceptions and a trap
Maya joins a few of Cedarbrook's invoices to the customer master. She uses a left join so that no invoice is lost, asks pandas to check that each invoice matches at most one customer, and adds an indicator column showing whether each row matched. She then demonstrates the duplication trap by joining the invoices to a contacts table that holds one row per contact person.
# Joining invoices to the customer master, and the duplication trap
import pandas as pd
invoices = pd.DataFrame({
    "inv_no":  [7001, 7002, 7003, 7004, 7005],
    "cust_no": ["C104", "C221", "C104", "C390", "C512"],
    "amount":  [4_200.0, 1_850.0, 3_100.0, 9_600.0, 2_400.0],
})
customers = pd.DataFrame({
    "cust_no": ["C104", "C221", "C390", "C455"],
    "name":    ["Lakeview Mechanical", "Aspen Builders",
                "Ridge Homes", "Harbor Electric"],
    "region":  ["West", "North", "West", "East"],
})
contacts = pd.DataFrame({            # one row per contact person
    "cust_no": ["C104", "C104", "C221", "C390"],
    "contact": ["A. Singh", "B. Moreau", "C. Diaz", "D. Kowalski"],
})
left = invoices.merge(customers, on="cust_no", how="left",
                      validate="many_to_one", indicator=True)
print(left[["inv_no", "cust_no", "name", "amount", "_merge"]].to_string(index=False))
orphans = left[left["_merge"] == "left_only"]
print("invoices with no customer record:", orphans["inv_no"].tolist())
unused = customers[~customers["cust_no"].isin(invoices["cust_no"])]
print("customers with no invoices:", unused["cust_no"].tolist())
print("invoice total:", invoices["amount"].sum())
wrong = invoices.merge(contacts, on="cust_no", how="left")
print("total after joining contacts:", wrong["amount"].sum(),
" rows:", len(wrong))inv_no cust_no name amount _merge 7001 C104 Lakeview Mechanical 4200.0 both 7002 C221 Aspen Builders 1850.0 both 7003 C104 Lakeview Mechanical 3100.0 both 7004 C390 Ridge Homes 9600.0 both 7005 C512 NaN 2400.0 left_only invoices with no customer record: [7005] customers with no invoices: ['C455'] invoice total: 21150.0 total after joining contacts: 28450.0 rows: 7
Invoice 7005 is for customer C512, which does not exist in the customer master. An inner join would have dropped it silently, and with it 2,400 of revenue; the left join with an indicator exposes it as an exception to investigate. It might be a new customer not yet set up, a keying error, or a sale to a fictitious customer. Customer C455 has no invoices in this extract, which may be perfectly normal or may indicate a dormant account that should be reviewed.
The last two lines show the trap. Joining invoices to contacts turns five invoices into seven rows, because Lakeview Mechanical has two contacts and two invoices, and the total rises from 21,150 to 28,450. Nothing failed and no warning appeared. If this joined table fed a revenue report, revenue would be overstated by more than a third. The defence is to know the cardinality of every join, check row counts and totals before and after, and aggregate or deduplicate the many side before joining when you only need one value per key.
Worked problem
Choosing a join
Maya wants a list of every payment Cedarbrook made in 2025 that does not correspond to a recorded vendor invoice. She has a payments table and an invoices table, both with vendor number and invoice number. Which join should she use, and on what key?
Show solution
- The question asks for rows in payments with no match in invoices: an anti join from payments to invoices.
- The key must identify an invoice uniquely: vendor number and invoice number together, since different vendors may use the same invoice numbers.
- Standardize both keys first, for example padding vendor numbers and removing punctuation from invoice numbers, or the anti join will report false exceptions.
- Check the result: reconcile payments in the exception list plus matched payments to the total of all payments.
Answer: An anti join from payments to invoices on the standardized vendor number and invoice number.
Wide and long layouts
The same data can be laid out wide, with one column per period or category, or long, with one row per combination and a single value column. Budgets, forecasts and many management reports are wide because they are designed to be read. Analysis tools prefer long data because it is tidy: one column for month, one for region, one for amount. Converting wide to long is called melting or unpivoting, and long to wide is pivoting.
| Layout | Example | Good for |
|---|---|---|
| Wide | One row per region; columns Jan, Feb, Mar | Reading, printing, data entry |
| Long | One row per region and month; columns region, month, amount | Filtering, joining, grouping, charting |
Cedarbrook's budget for the first quarter arrives as a wide spreadsheet, and actual sales arrive as a long list of daily or invoice-level transactions. To compare them, Maya melts the budget into long form, aggregates actuals to the same level of region and month, joins the two, computes the variance and pivots the result back into a wide table for reading.
# Reshaping: a wide budget to long form, then a pivot of actual vs budget
import pandas as pd
budget_wide = pd.DataFrame({
    "region": ["North", "Central", "West"],
    "Jan": [1300, 1900, 1000], "Feb": [1250, 1850, 1050],
    "Mar": [1400, 2000, 1150],
})                                     # $ thousands
budget = budget_wide.melt(id_vars="region", var_name="month",
                          value_name="budget")
actual = pd.DataFrame({
    "region": ["North", "North", "North", "Central", "Central", "Central",
               "West", "West", "West", "West"],
    "month":  ["Jan", "Feb", "Mar", "Jan", "Feb", "Mar",
               "Jan", "Feb", "Mar", "Mar"],
    "sales":  [1280, 1310, 1385, 1950, 1790, 2060, 980, 1120, 900, 640],
})
act = actual.groupby(["region", "month"], as_index=False)["sales"].sum()
both = budget.merge(act, on=["region", "month"], how="left")
both["variance"] = both["sales"] - both["budget"]
table = both.pivot_table(index="region", columns="month", values="variance",
                         aggfunc="sum", sort=False)[["Jan", "Feb", "Mar"]]
table["Q1"] = table.sum(axis=1)
print(budget.head(4).to_string(index=False))
print(table.to_string())region month budget North Jan 1300 Central Jan 1900 West Jan 1000 North Feb 1250 month Jan Feb Mar Q1 region North -20 60 -15 25 Central 50 -60 60 50 West -20 70 390 440
The order of operations matters. The actual data contain two rows for West in March, perhaps two separate batches, so Maya aggregates actuals to one row per region and month before joining. If she had joined the raw actuals to the budget, the West March budget of 1,150 would have been repeated on both rows, and summing the joined table would have doubled it. Aggregate first, then join, is a rule worth remembering. The West region's first-quarter sales came in 440 thousand above budget, almost all in March, which fits the story from lesson 1 of a large new contract in the West.
Aggregating
Aggregation summarizes many rows into fewer: totals, counts, averages, minimums and maximums by group. In pandas this is groupby; in SQL it is GROUP BY; in a spreadsheet it is a pivot table or SUMIFS. Three issues come up repeatedly in accounting work.
- Choose the right statistic. Sums and counts add up across groups; averages and percentages do not. The average margin of five branches is not the company's margin unless the branches are the same size. Compute ratios from summed numerators and denominators, as lesson 1 did for gross margin.
- Decide how to count. Counting invoice lines is not counting invoices, and counting invoices is not counting customers. Use distinct counts where the question is about unique entities.
- Watch for missing groups. A group with no transactions does not appear in the aggregated output at all. A monthly report built by grouping transactions will skip a month with no sales rather than show a zero. Joining to a complete list of months, sometimes called a date dimension or calendar table, restores the missing rows.
Derived fields
Many analyses need fields that are not in the source data but can be computed from it. Common derived fields in accounting include the fiscal period and quarter from a posting date; days outstanding from an invoice date and a reporting date; an aging bucket such as 0 to 30, 31 to 60 or over 90 days; the day of the week, to find weekend postings; flags such as round amount or posted after period end; and a sign-adjusted amount. Derived fields should be computed in the preparation script, documented in the data dictionary, and tested on a few records by hand.
A calendar table is worth building once and reusing. It has one row per date, with columns for the fiscal year, period, quarter, week, day of week, whether it is a business day and whether it falls in a closing window. Joining transactions to the calendar adds all these attributes at once and keeps definitions consistent across every analysis. Business intelligence tools such as Power BI expect a calendar table for exactly this reason.
The same work in a spreadsheet
Spreadsheets handle joins with lookup functions. XLOOKUP, which replaced VLOOKUP in current versions of Excel, returns a value from a matching row in another range. A lookup behaves like a left join that returns only the first match, so it never multiplies rows, but it also hides the fact that a key has several matches. Missing matches return an error, or a value you specify with the if-not-found argument, which makes a natural exception flag. For larger or repeated work, Power Query's Merge Queries offers all the join kinds in the table above, including left anti and right anti, and its Unpivot Columns command melts wide data into long form. Pivot tables then aggregate and reshape the long data for reading.
Common mistakes
MistakeUsing an inner join by default.
InsteadChoose the join deliberately; use a left join with an indicator, or an anti join, to see unmatched records.
MistakeJoining without checking the cardinality of the key.
InsteadConfirm the key is unique where expected, and compare row counts and totals before and after the join.
MistakeJoining before aggregating the many side.
InsteadAggregate to one row per key first, then join.
MistakeAveraging percentages across groups of different sizes.
InsteadSum numerators and denominators separately, then divide.
MistakeAssuming every month appears in a grouped result.
InsteadJoin to a calendar table so periods with no activity show as zero.
Summary and key terms
- Tidy data have one variable per column and one observation per row; analyse tidy data, then format results for people.
- Inner joins drop unmatched rows; left joins keep them; anti joins list exceptions.
- Know the cardinality of every join: many-to-many joins multiply rows and inflate totals.
- Standardize keys on both sides before joining.
- Melt wide data to long for analysis; pivot long data to wide for reading.
- Aggregate before joining, compute ratios from summed parts, and use distinct counts where needed.
- A calendar table supplies fiscal periods and restores missing periods.
- XLOOKUP returns the first match only; Power Query merges support every join kind, including anti joins.
- Tidy data
- A layout with one variable per column, one observation per row and one table per kind of unit.
- Join
- An operation that combines rows of two tables on matching key values.
- Left join
- A join that keeps every row of the left table, matched or not.
- Anti join
- A join that keeps rows of the left table that have no match in the right table.
- Cardinality
- The one-to-one, one-to-many or many-to-many relationship between keys in two tables.
- Melt (unpivot)
- Converting a wide table into a long one.
- Pivot
- Converting a long table into a wide one, often with aggregation.
- Aggregation
- Summarizing many rows into fewer, such as totals or counts by group.
- Calendar table
- A table with one row per date and columns for fiscal periods and other date attributes.
- Derived field
- A new column computed from existing data.
Practice problems
Work each problem on paper first, then reveal the answer to check.
Which join lists vendor invoices that were never paid?
Show answer
An anti join from invoices to payments.
A customer has three invoices and two shipping addresses. How many rows result from joining invoices to addresses on customer number?
Show answer
Six.
In the join program, what would an inner join have done to invoice 7005?
Show answer
Dropped it, losing 2,400 of revenue without warning.
Change the contacts join in the program to use only the first contact per customer. How?
Show answer
Drop duplicates on cust_no in contacts first, for example contacts.drop_duplicates("cust_no"), then join.
Why does the reshape program aggregate actuals before joining to the budget?
Show answer
West March has two actual rows; joining first would repeat the budget and double it when summed.
What was the West region's March variance in the program?
Show answer
390 thousand above budget.
Two branches have margins of 30 and 10 per cent and revenues of 1 million and 9 million. What is the combined margin?
Show answer
12 per cent: 0.3 million plus 0.9 million on 10 million.
Why might a monthly sales report skip a month?
Show answer
No transactions in that month means no group in the output; join to a calendar table.
Name two derived fields useful for journal entry testing.
Show answer
Day of week, posted after period end, round amount flag, or user role.
How does XLOOKUP behave when a key has two matches?
Show answer
It returns the first match only, hiding the duplicate.
Lesson quiz · 5 questions
Score 60% or more to complete this lesson.
Create a free account to save your progress, take quizzes and earn a certificate.