
ACCT-222 · Lesson 5 of 12 · 27 min
Time-driven ABC and customer profitability
The ABC system in lesson 4 was built from interviews in which staff estimated the percentage of their time spent on each activity. That approach works, but it has drawbacks that surface quickly in practice. Interviews are expensive to repeat, so the model goes stale. People tend to report that 100 per cent of their time is spent on activities, so the model hides idle capacity. And adding a new activity or a variation of an existing one, such as an expedited order, means re-surveying everyone. Time-driven activity-based costing (TDABC), developed by Robert Kaplan and Steven Anderson in the early 2000s, addresses all three problems by asking two simpler questions: what does it cost per minute to supply capacity, and how many minutes does each transaction take?
The two parameters of TDABC
TDABC needs only two estimates for each department. The first is the capacity cost rate: the total cost of the resources supplied to the department divided by the practical capacity of those resources, usually measured in minutes or hours. The second is the unit time for each activity: how long it takes to perform one transaction, such as processing an order or handling a claim. The cost of an activity is then simply the capacity cost rate multiplied by the time it takes.
Practical capacity is lower than theoretical capacity because people need breaks, training and meetings, and machines need maintenance. A common rule of thumb is that practical capacity for people is about 80 to 85 per cent of paid time, and for machines about 85 per cent of theoretical time, but each organization should estimate its own figures.
Halden's customer service department
Halden's customer service department handles dealer orders, schedules installations for Halden Service, processes warranty claims and answers technical inquiries from dealers and contractors. It has 25 staff. Its quarterly cost, including salaries, benefits, supervision, the telephone and ticketing systems, and office space, is $378,000. Each employee is paid for about 600 hours a quarter, of which about 480 hours (80 per cent) are available for customer work after breaks, training and meetings.
Worked problem
The capacity cost rate
Compute the capacity cost rate for Halden's customer service department.
Show solution
- Practical capacity = 25 staff × 480 hours = 12,000 hours = 720,000 minutes a quarter.
- Capacity cost rate = $378,000 ÷ 720,000 minutes = $0.525 per minute.
Answer: Each minute of customer service capacity costs $0.525, or $31.50 an hour.
Time estimates come from direct observation, system timestamps or short studies, not from asking people to allocate their whole week. Halden's ticketing system already records how long a representative spends on each call or case, so the averages are readily available.
| Activity | Unit time (minutes) | Quarterly volume | Minutes used | Cost at $0.525/min |
|---|---|---|---|---|
| Process a dealer order | 8 | 18,000 | 144,000 | $75,600 |
| Schedule an installation | 12 | 6,000 | 72,000 | $37,800 |
| Handle a warranty claim | 35 | 4,000 | 140,000 | $73,500 |
| Answer a technical inquiry | 20 | 14,000 | 280,000 | $147,000 |
| Total used | 636,000 | $333,900 | ||
| Unused capacity | 84,000 | $44,100 | ||
| Practical capacity supplied | 720,000 | $378,000 |
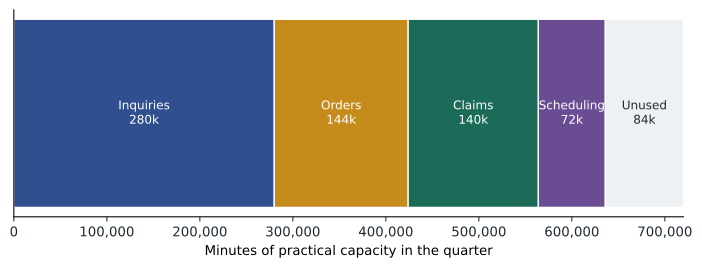
The table shows the main advantage of TDABC over interview-based ABC: unused capacity becomes visible. The activities consumed 636,000 minutes, about 88 per cent of practical capacity, so $44,100 of the department's quarterly cost bought capacity that was not used. Under conventional ABC, staff would have reported spending all their time on the four activities, and those costs would have been spread over the activities, inflating every activity rate by about 13 per cent.
Time equations
Real transactions vary. An order from a new dealer takes longer than a repeat order, and an expedited order needs extra coordination with the warehouse. TDABC handles this variation with time equations, which express the time for an activity as a base time plus increments for each characteristic that adds work. The equation can draw directly on fields already in the order-entry system.
Here expedited and new dealer take the value 1 if true and 0 otherwise. A routine six-line order from an established dealer takes 5 + 3 = 8 minutes; the same order expedited for a new dealer takes 5 + 3 + 6 + 10 = 24 minutes and costs three times as much to process. A single equation replaces what would have been several separate activities in a conventional ABC model.
# Time equation for processing a dealer order (illustrative)
RATE = 0.525                       # dollars per minute of capacity

def order_minutes(lines, expedited=False, new_dealer=False):
    return 5 + 0.5 * lines + 6 * expedited + 10 * new_dealer

orders = [
    ("Routine 6-line order", 6, False, False),
    ("Large 30-line stocking order", 30, False, False),
    ("Expedited 4-line order", 4, True, False),
    ("New dealer, expedited, 6 lines", 6, True, True),
]
for label, lines, exp, new in orders:
    m = order_minutes(lines, exp, new)
print(f"{label:<32} {m:5.1f} min ${m * RATE:6.2f}")Routine 6-line order 8.0 min $ 4.20 Large 30-line stocking order 20.0 min $ 10.50 Expedited 4-line order 13.0 min $ 6.83 New dealer, expedited, 6 lines 24.0 min $ 12.60
Time equations make the model easy to maintain. When Halden introduces online ordering through a dealer portal, the base time for portal orders might fall from 5 minutes to 1 minute, and the accountant needs to change only that coefficient, not re-interview the department.
Building the customer cost model step by step
Halden built its customer cost model in four steps over about six weeks. First, the controller and the customer service manager agreed on the activities to model and pulled average handling times for each from the ticketing system, checking a sample of cases by observation. Second, they computed the capacity cost rate, separating the department's fixed costs (supervision, systems, space) from staff costs to confirm that the rate reflected the resources actually supplied. Third, they linked each order, claim and inquiry in the ticketing and order-entry systems to a dealer account number, so that every transaction could be priced and summed by customer. Fourth, they reconciled the total assigned cost plus unused capacity to the department's actual expenses for the quarter, which is a basic control on any costing model.
The same capacity cost rate approach can be applied to other support departments. Halden's warehouse could be modelled with minutes per pick and per pallet loaded; Halden Service's dispatch office with minutes per job scheduled and per emergency call. Each department gets its own capacity cost rate, because a minute of a warehouse worker's time does not cost the same as a minute of a dispatcher's time. Combining the departments gives a complete picture of the cost to serve each customer, which is the foundation for the profitability analysis that follows.
Customer profitability analysis
Products are not the only cost objects that matter. Two dealers buying the same pumps at the same list price can be very different in profitability if one orders in full truckloads with few service calls and the other places frequent small rush orders, demands technical support and files many warranty claims. Customer profitability analysis assigns revenues and the costs of serving each customer, so that managers can see which customers create value and which consume more than they pay for.
A customer profitability report starts with revenue net of discounts, subtracts the cost of the products sold (using ABC product costs, so that a customer buying many custom pumps bears their true cost), and then subtracts customer-level costs: order processing, installation scheduling, warranty and technical support, delivery, and any special terms. TDABC supplies these customer-level costs directly, because each order, claim and inquiry can be priced with its time equation.
| Aqua Supply (distributor) | Brightwater Plumbing | Delta Contractors | |
|---|---|---|---|
| Pumps bought (S-100 / P-300 / C-900) | 3,000 / 400 / 0 | 600 / 300 / 10 | 200 / 150 / 40 |
| Revenue after discounts | $632,000 | $231,000 | $151,000 |
| Product cost (ABC) | $489,000 | $184,000 | $116,000 |
| Orders (lines per order, expedited) | 40 (30 lines, none) | 120 (6 lines, 25%) | 160 (4 lines, 60%) |
| Warranty claims | 30 | 45 | 90 |
| Technical inquiries | 50 | 220 | 600 |
# Customer profitability with time-driven ABC (illustrative)
RATE = 0.525
def order_min(lines, expedited): return 5 + 0.5 * lines + 6 * expedited

dealers = {   # revenue, ABC product cost, orders, lines, expedited share, claims, inquiries
    "Aqua Supply": (632_000, 489_000, 40, 30, 0.00, 30, 50),
    "Brightwater": (231_000, 184_000, 120, 6, 0.25, 45, 220),
    "Delta":       (151_000, 116_000, 160, 4, 0.60, 90, 600),
}
for name, (rev, prod, n, lines, exp, claims, inq) in dealers.items():
    order_cost = n * order_min(lines, exp) * RATE
    claim_cost = claims * 35 * RATE
    inq_cost = inq * 20 * RATE
    serve = order_cost + claim_cost + inq_cost
    profit = rev - prod - serve
    print(f"{name:<12} gross margin {rev - prod:>8,.0f}  cost to serve {serve:>7,.0f}"
f" customer profit {profit:>8,.0f} ({profit / rev:5.1%} of revenue)")Aqua Supply gross margin 143,000 cost to serve 1,496 customer profit 141,504 (22.4% of revenue) Brightwater gross margin 47,000 cost to serve 3,735 customer profit 43,265 (18.7% of revenue) Delta gross margin 35,000 cost to serve 8,844 customer profit 26,156 (17.3% of revenue)
Aqua Supply, the large distributor, earns Halden about $141,500 a year after the cost of serving it, about 22 per cent of revenue, because its few large orders and rare inquiries cost only about $1,500 of customer service time. Brightwater earns about $43,300. Delta Contractors looks reasonable on gross margin ($35,000) but consumes about $8,800 of customer service time, six times Aqua's, through frequent small expedited orders, heavy technical support and many warranty claims, leaving about $26,200, or 17 per cent of revenue. In a fuller analysis, Halden would also assign delivery costs, installation scheduling, dealer incentives and the field warranty repairs performed by Halden Service, which would reduce Delta's profit further because its warranty claims involve more C-900 pumps.
The whale curve
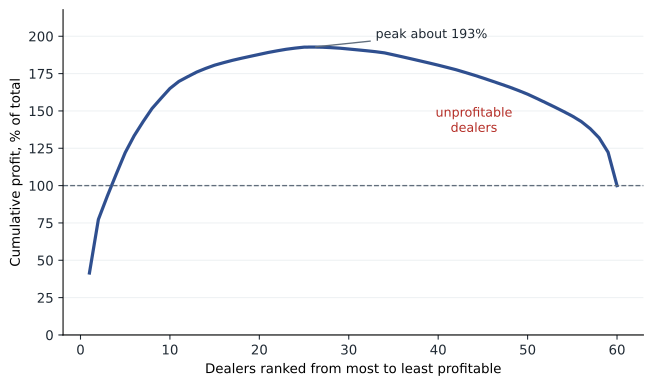
When customer profitability is computed for every customer and the customers are sorted from most to least profitable, plotting cumulative profit against cumulative customers produces a characteristic shape called a whale curve. Cumulative profit rises steeply with the most profitable customers, often reaching 150 to 300 per cent of total profit, then falls back as unprofitable customers erode it, ending at 100 per cent of actual total profit. The curve gets its name from its resemblance to a whale rising out of the water.
# A whale curve for 60 simulated dealer accounts (illustrative, seeded)
import random
random.seed(222)
profits = []
for _ in range(60):
    size = random.lognormvariate(11, 0.9)           # annual revenue
    margin = random.gauss(0.24, 0.04) * size        # gross margin
    serve = random.uniform(0.04, 0.30) * size       # cost to serve
    profits.append(margin - serve - 4_000)          # fixed account cost
profits.sort(reverse=True)
total = sum(profits)
running, peak = 0, 0
for i, p in enumerate(profits, 1):
    running += p
    peak = max(peak, running)
losers = sum(p < 0 for p in profits)
print(f"Total profit from 60 dealers: ${total:,.0f}")
print(f"Peak cumulative profit: ${peak:,.0f} ({peak / total:.0%} of total)")
print(f"Unprofitable dealers: {losers} of 60")Total profit from 60 dealers: $159,848 Peak cumulative profit: $308,157 (193% of total) Unprofitable dealers: 34 of 60
In this simulated example, the profitable dealers generate cumulative profit of roughly 193 per cent of the final total, and more than half of the accounts lose money before the unprofitable ones bring it back down to 100 per cent. The exact numbers depend on the assumptions, but the shape is typical of real customer bases. It tells managers that the biggest opportunity often lies not in finding more customers but in converting unprofitable relationships into profitable ones.
Acting on customer profitability
An unprofitable customer is a problem to solve, not automatically a customer to drop. The options include the following:
- Repricing services: charging for expedited orders, minimum order sizes or premium technical support, so that customers who demand costly service pay for it.
- Changing the cost to serve: moving orders to the dealer portal, offering online troubleshooting guides, or bundling small orders into scheduled weekly deliveries.
- Changing the mix: encouraging the customer to buy products that suit its needs and are profitable for Halden, such as the S-100 for routine residential work.
- Investing selectively: some currently unprofitable customers are new and growing, or strategically important, and are worth serving at a loss for a time.
- As a last resort, ending the relationship, after checking which costs will actually be avoided and whether the customer influences other sales.
Delta Contractors' pattern of many small expedited orders and heavy technical support could be addressed with a small expedite fee and a training session for its installers, which would likely cut its inquiries in half. The TDABC model can test such options quickly: halving Delta's inquiries saves 300 × 20 minutes × $0.525 = $3,150 of capacity a year, but only if the freed capacity is actually redeployed or the department's staffing grows more slowly than it otherwise would.
Limits and cautions
TDABC relies on good time estimates; if the unit times are wrong, the costs are wrong. It also tends to be most useful in departments with repetitive, measurable transactions, such as customer service, order processing, claims handling and maintenance scheduling; it is harder to apply to creative or highly variable work such as engineering design. And customer profitability is only as good as the product costs underneath it. Halden's analysis uses the ABC product costs from lesson 4; if it had used the plantwide costs, customers buying many C-900s would have looked far more profitable than they are.
Customer data also raise privacy considerations when the customers are individuals rather than businesses.
In Canada, personal information about individual customers is protected by PIPEDA, or by provincial laws such as Quebec's Law 25, which require that it be collected and used for identified purposes. Business-to-business customer profitability analysis like Halden's dealer analysis rarely involves personal information, but service records for homeowners do.
Common mistakes
MistakeUsing theoretical capacity to compute the capacity cost rate.
InsteadUse practical capacity, which allows for breaks, training and maintenance.
MistakeSpreading the cost of unused capacity over the activities performed.
InsteadReport unused capacity separately so managers can act on it.
MistakeCreating a separate activity for every variation of a transaction.
InsteadUse time equations with terms for each characteristic that adds time.
MistakeJudging customers by gross margin alone.
InsteadSubtract the cost to serve each customer, including orders, support and warranty.
MistakeDropping every customer on the declining side of the whale curve.
InsteadTry repricing, process changes and mix changes first, and check which costs would really be avoided.
Summary and key terms
- TDABC needs two parameters: the capacity cost rate and the unit time of each activity.
- The capacity cost rate is the cost of resources supplied divided by their practical capacity.
- TDABC reveals unused capacity instead of spreading it over activities.
- Time equations capture variations in transactions with a base time plus increments.
- Customer profitability subtracts ABC product costs and the cost to serve from customer revenue.
- Whale curves typically show profitable customers generating well over 100 per cent of profit before unprofitable ones bring it down.
- Unprofitable customers can often be made profitable through repricing, process changes and mix changes.
- Time-driven activity-based costing
- An ABC method that uses a capacity cost rate and activity times instead of time-allocation surveys.
- Capacity cost rate
- Cost of resources supplied divided by their practical capacity.
- Practical capacity
- The capacity available after allowing for breaks, training, maintenance and other unavoidable downtime.
- Unit time
- The time required to perform one instance of an activity.
- Time equation
- An expression giving an activity's time as a base plus increments for characteristics that add work.
- Cost to serve
- The customer-level costs of selling to and supporting a customer.
- Customer profitability analysis
- Reporting revenue and costs for individual customers or customer groups.
- Whale curve
- A plot of cumulative profit against customers ranked from most to least profitable.
- Customer-level cost
- A cost driven by serving a particular customer rather than by products.
- Unused capacity cost
- The cost of capacity supplied but not used in the period.
Practice problems
Work each problem on paper first, then reveal the answer to check.
A department costs $240,000 a quarter and has 10 staff with 500 practical hours each. Compute the capacity cost rate per minute.
Show answer
$240,000 ÷ 300,000 minutes = $0.80.
At that rate, what does a 15-minute claim cost?
Show answer
$12.00.
Using Halden's time equation, how long does a 12-line expedited order from an established dealer take?
Show answer
5 + 6 + 6 = 17 minutes.
What does that order cost at $0.525 per minute?
Show answer
About $8.93.
Halden's customer service handles 20 per cent more technical inquiries next quarter. How much unused capacity remains?
Show answer
Inquiries use 336,000 minutes; total used 692,000; unused 28,000 minutes ($14,700).
Why is unused capacity hidden in interview-based ABC?
Show answer
Staff report how their time is divided among activities, typically summing to 100 per cent, so idle time is spread over activities.
A dealer has a gross margin of $18,000 and a cost to serve of $21,000. Suggest two actions short of dropping it.
Show answer
Charge for expedited orders or minimum order sizes; move ordering to the portal or train its installers to reduce inquiries.
Why should customer profitability use ABC product costs?
Show answer
Otherwise customers buying complex, low-volume products appear more profitable than they are.
If Halden's portal cuts the base order time from 5 to 1 minute for half of orders, how many minutes does it save per quarter on 18,000 orders?
Show answer
9,000 × 4 = 36,000 minutes ($18,900).
When does a saving shown by TDABC become a real cash saving?
Show answer
When the freed capacity is removed, redeployed, or used to absorb growth that would otherwise require more resources.
Lesson quiz · 5 questions
Score 60% or more to complete this lesson.
Create a free account to save your progress, take quizzes and earn a certificate.