
ACCT-222 · Lesson 12 of 12 · 26 min
Capstone: redesigning the cost system of Halden Pumps
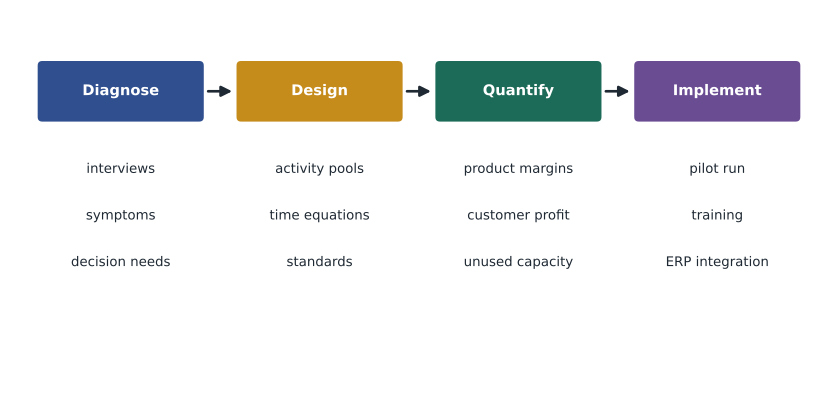
This capstone brings the course together. Halden's board has asked the new controller to review the company's cost system and recommend changes before next year's budget. The request follows a difficult year: residential dealers say the S-100 is overpriced, the C-900 custom line has grown but company profits have not, Halden Service's warranty costs keep rising, and the plant ran below its normal capacity. The controller's task is to diagnose the problems, design a better system, quantify what it shows, plan the implementation and report the results in a form the board can act on. The lesson works through each stage, drawing on earlier lessons; all figures are the illustrative Halden data used throughout the course.
Stage 1: diagnosis
The controller begins by asking what decisions the cost system must support and how well it supports them now. Interviews with the sales director, the plant manager, the service manager and the chief engineer, together with a review of the past three years' reports, produce a list of symptoms that match the warning signs from lesson 1:
- Product costs come from a single plantwide rate of $50 per direct labour hour, set when the S-100 dominated production. Sales staff ignore them when quoting custom work.
- Competitors sell residential pumps profitably at prices the cost system says would lose money.
- The C-900 shows the highest gross margin of any product, yet its growth has coincided with falling company profit.
- Customer service, warranty and field service costs are treated as period expenses and never reach product or customer profitability reports.
- Fixed overhead rates use a budget-based denominator, so product costs rise in slow years, and the production-volume variance is reported but not understood.
- Standards were last revised four years ago; the foundry's yield and the assembly line's labour mix routinely produce unfavourable variances that supervisors regard as normal.
Each symptom points to a lesson in this course. Together they suggest that the system was designed for a simpler business and has not kept up with Halden's growth in product variety and services.
Stage 2: design
The controller proposes a design with six elements, each tested against the cost-benefit principle from lesson 1: refine only where better information will change decisions enough to justify the extra effort.
| Element | Current practice | Proposed practice | Lesson |
|---|---|---|---|
| Manufacturing overhead | One plantwide rate on direct labour hours | Five activity pools (machining, set-ups, engineering, inspection, facility) with cause-and-effect drivers | 4 |
| Support departments | Maintenance and IT costs folded into plant overhead | Reciprocal allocation, dual rates, budgeted rates | 6 |
| Customer service and Halden Service | Period expenses, not analysed | Time-driven ABC with capacity cost rates and time equations; customer profitability reports | 5 |
| Process departments | Weighted-average reports; spoilage buried in unit cost | FIFO reports for managers; normal and abnormal spoilage separated | 2, 3 |
| Standards and capacity | Four-year-old standards; budget-based denominator | Annual standard review with mix and yield variances; practical-capacity rates for management reports, normal capacity for external reporting | 8, 9, 10 |
| Strategic cost management | None formalized | Target costing for new products; quarterly cost of quality report | 11 |
Stage 3: quantify
The redesigned system produces three new views of Halden's profitability: product costs that reflect resource use, customer costs that reflect the cost to serve, and an explicit cost of unused capacity. The product view combines the ABC manufacturing costs from lesson 4 with the field service cost of each product line. Halden Service records warranty and service calls by pump model, so its warranty cost can be traced: in the past year it spent about $380,000 on warranty repairs, of which about $60,000 related to the S-100, $120,000 to the P-300 and $200,000 to the C-900.
# Product-line profitability: old system versus redesigned system (illustrative)
lines = {   # units, price, DM, DL hours, plantwide OH/unit, ABC OH/unit, warranty cost
    "S-100": (20_000, 175, 60, 1.0, 50.00, 29.06, 60_000),
    "P-300": (5_000, 390, 140, 2.0, 100.00, 110.12, 120_000),
    "C-900": (500, 1_650, 520, 6.0, 300.00, 1_036.36, 200_000),
}
WAGE = 32
print(f"{'Line':<6}{'Old margin':>12}{'New margin':>12}{'Old %':>8}{'New %':>8}")
tot_old = tot_new = 0
for name, (u, p, dm, h, pw, abc, warranty) in lines.items():
    rev = u * p
    old = rev - u * (dm + h * WAGE + pw)
    new = rev - u * (dm + h * WAGE + abc) - warranty
    tot_old += old; tot_new += new
    print(f"{name:<6}{old:>12,.0f}{new:>12,.0f}{old / rev:>8.1%}{new / rev:>8.1%}")
print(f"Total old {tot_old:,.0f}; total new {tot_new:,.0f} "
f"(difference = warranty costs now assigned: {tot_old - tot_new:,.0f})")Line Old margin New margin Old % New % S-100 660,000 1,018,800 18.9% 29.1% P-300 430,000 259,400 22.1% 13.3% C-900 319,000 -249,180 38.7% -30.2% Total old 1,409,000; total new 1,029,020 (difference = warranty costs now assigned: 379,980)
The old system reported gross margins of $660,000 on the S-100, $430,000 on the P-300 and $319,000 on the C-900. After assigning activity costs and warranty costs, the S-100 earns about $1,019,000 (29 per cent of revenue), the P-300 about $259,000 (13 per cent), and the C-900 loses about $249,000. Total margin falls only by the $380,000 of warranty costs that were previously treated as period expenses; the rest is a redistribution among products, as ABC always is. The pattern is now unmistakable: the high-volume residential pump subsidizes the custom line.
From numbers to decisions
The controller is careful not to recommend dropping the C-900. Its engineering and set-up resources are partly committed, it brings in municipal customers who also buy P-300s, and it keeps Halden's engineering team capable of serving demanding industrial clients. Instead, the controller models a package of changes: reprice the C-900 and require a minimum order of ten pumps, so that batch sizes double and set-ups halve; use the S-100's cost advantage to cut its dealer price modestly and win back residential share lost in lesson 10; and launch a seal improvement programme to cut warranty failures.
# Testing the proposed action package (illustrative)
WAGE = 32
setup_rate, eng_rate = 1_500, 5_000

def c900(units, price, setups, warranty, eng_factor=1.0):
    # unit-level ABC overhead per C-900 excluding set-ups: machining, engineering,
    # inspection and facility from lesson 4; eng_factor scales engineering changes
    other_oh = 75_000 + eng_factor * 200_000 + 75_000 + 18_182
    oh = other_oh * units / 500 + setups * setup_rate
    return units * (price - 520 - 6 * WAGE) - oh - warranty

def s100(units, price, warranty):
    oh_per_unit = 29.06
    return units * (price - 60 - WAGE - oh_per_unit) - warranty

base = s100(20_000, 175, 60_000) + c900(500, 1_650, 100, 200_000)
plan = s100(22_400, 168, 45_000) + c900(420, 1_950, 42, 120_000, eng_factor=0.75)
print(f"S-100 and C-900 margin now:      {base:>11,.0f}")
print(f"S-100 and C-900 margin proposed: {plan:>11,.0f}")
print(f"Improvement: {plan - base:>11,.0f}")S-100 and C-900 margin now: 769,618 S-100 and C-900 margin proposed: 1,076,143 Improvement: 306,525
The model assumes that a $7 cut in the S-100's dealer price lifts volume by 12 per cent, that a C-900 price of $1,950 and a ten-pump minimum lose 16 per cent of custom volume while cutting set-ups from 100 to 42 a year and engineering changes by a quarter, and that the seal programme cuts warranty costs on both lines. On those assumptions, the margin of the two lines rises from about $770,000 to about $1,076,000, an improvement of about $307,000 a year, before the cost of the seal programme. The assumptions about customer response are the most uncertain part, so the controller presents a range: if S-100 volume rises only 5 per cent and C-900 volume falls 30 per cent, the improvement shrinks but remains positive, as the next block shows.
# Pessimistic case for the action package (illustrative)
WAGE = 32
def c900(units, price, setups, warranty, eng_factor=1.0):
    other_oh = 75_000 + eng_factor * 200_000 + 75_000 + 18_182
    return units * (price - 520 - 6 * WAGE) - other_oh * units / 500 - setups * 1_500 - warranty
def s100(units, price, warranty):
    return units * (price - 60 - WAGE - 29.06) - warranty
base = s100(20_000, 175, 60_000) + c900(500, 1_650, 100, 200_000)
pessimistic = s100(21_000, 168, 50_000) + c900(350, 1_950, 35, 130_000, eng_factor=0.85)
print(f"Base margin        {base:>11,.0f}")
print(f"Pessimistic margin {pessimistic:>11,.0f}")
print(f"Improvement {pessimistic - base:>11,.0f}")Base margin 769,618 Pessimistic margin 949,813 Improvement 180,195
Even with weaker volume responses, smaller warranty savings and only a 15 per cent cut in engineering changes, the package improves margin, because the C-900 loses less money at a higher price and the S-100 still sells more. Most of the gain comes from the C-900. The controller also reports the break-even response for the S-100 price cut. Measured against full ABC cost, each pump earns about $54 before the cut and $47 after it, so volume must rise about 15 per cent to break even. Measured against variable cost only (materials, labour and $5 of variable machining overhead), each pump contributes $78 before and $71 after, so the break-even rise is about 10 per cent. The assumed 12 per cent rise sits between the two, so the controller recommends testing the price cut with a group of dealers for one quarter before rolling it out. The savings in set-up and engineering cost are real only if Halden redeploys the freed set-up technician and engineering hours, as lesson 4 warned, for example to the new S-50 compact pump launched through target costing in lesson 11.
Customer and capacity views
The customer view, built with time-driven ABC, shows that the 20 per cent of dealers who place frequent small expedited orders consume more than half of customer service capacity. The controller recommends a dealer portal, a small expedite fee and an installer training programme, expected to reduce customer service minutes by about 15 per cent. The capacity view shows about $63,600 of unused machining capacity at practical capacity, plus about $44,100 a quarter of unused customer service capacity. Rather than cut staff immediately, the controller proposes to absorb the capacity with the S-100 volume growth and the S-50 launch, and to defer two planned hires in customer service.
Stage 4: implementation
A redesign succeeds only if people use it. The controller's implementation plan follows the lessons of ABC projects in lesson 4:
- Sponsorship: the chief executive and the board's audit committee approve the project and its objectives.
- A cross-functional team: the controller, the plant manager, the chief engineer, the sales director and the service manager meet monthly.
- A pilot: run the new system alongside the old one for two quarters, reconcile the two each month and explain differences before using the new costs for pricing.
- Integration: capture driver quantities (set-ups, engineering change orders, inspection hours, service tickets) automatically in the ERP and ticketing systems, rather than through manual surveys.
- Training and communication: explain to every product manager why their product costs changed, using the activity data rather than accounting jargon.
- Review: update activity rates, time equations and standards annually, and whenever processes change significantly.
External reporting is unaffected in principle: inventories will still be measured at full absorption cost using normal capacity, as required for financial statements. But because the ABC product costs differ from the plantwide costs, the year-end inventory value will change, and the auditors must be satisfied that the new allocation is rational and consistently applied. The controller documents the change in the accounting policy file and discusses it with the auditors before the first year-end under the new system.
Governance, ethics and contract costing
Cost system changes affect managers' bonuses, product pricing and, where government contracts exist, revenue. The controller therefore establishes three safeguards. First, allocation bases and capacity assumptions are documented and approved before the year begins, not adjusted after results are known. Second, the cost of unused capacity is reported separately and not loaded onto any product, customer or contract. Third, product managers can challenge activity data through a formal review, but cannot change the methodology.
Halden sells C-900 pumps to a federal agency under a cost-reimbursable contract that incorporates the Contract Cost Principles in SACC 1031-2. The contract requires costs to be determined using Halden's generally accepted, consistently applied cost accounting practices, with indirect costs allocated on bases that reflect the benefit each contract receives. Changing to ABC is permissible, but Halden must disclose the change, apply it consistently to all work, and be able to show the contracting authority that the new allocation does not shift costs onto the government contract. CPA Canada's code of professional conduct requires the controller to act with integrity and objectivity throughout.
The board report
The final deliverable is a short report for the board, built around decisions rather than accounting methods. The controller's report has five parts: a one-page summary of findings and recommendations; product-line profitability under the old and new systems, with the reasons for the differences; customer profitability and the whale curve; the action package with its expected effect and the range of outcomes; and the implementation plan, timetable and cost (about $120,000 of consulting, software configuration and staff time over nine months). Detailed activity data, variance analyses and reconciliations go in appendices for the audit committee.
The report closes with the limits of the analysis: activity costs are estimates, customer responses to price changes are uncertain, and some benefits, such as retaining municipal customers through the custom line, cannot be measured precisely. Stating these limits openly is part of the professional judgement this course has emphasized. A cost system's value lies not in precision for its own sake but in helping managers make better decisions with their eyes open.
| Question from the board | Where the answer comes from |
|---|---|
| Which products earn their keep? | ABC product costs plus traced warranty costs (lessons 4 and 12) |
| Which customers earn their keep? | Time-driven ABC customer profitability and the whale curve (lesson 5) |
| Why did profit miss budget? | Cost variances, sales-mix, market-size and market-share variances (lessons 8 to 10) |
| How much idle capacity are we paying for? | Practical-capacity rates and unused capacity reports (lessons 5, 9 and 10) |
| Where is quality costing us money? | Spoilage reports and the cost of quality (lessons 3 and 11) |
| Should we launch the S-50? | Target costing and life-cycle budgets (lesson 11) |
Common mistakes
MistakeTreating the redesign as an accounting project.
InsteadBuild it around the decisions it must support, with operations, sales and service on the team.
MistakeRecommending that a product be dropped because ABC shows a loss.
InsteadTest repricing, batch-size and design changes, and check which costs would actually be avoided.
MistakeClaiming savings from freed capacity without a plan to use or remove it.
InsteadIdentify how freed resources will be redeployed or reduced.
MistakeSwitching to the new costs for pricing without a parallel run.
InsteadPilot alongside the old system and reconcile differences first.
MistakeAdjusting allocation bases after results are known.
InsteadApprove methods in advance and keep unused capacity separate, especially where contract costs are involved.
Summary and key terms
- A cost system redesign moves through diagnosis, design, quantification and implementation.
- Halden's redesign combines ABC for overhead, time-driven ABC for services, reciprocal support allocations, FIFO and spoilage reporting, updated standards and practical-capacity rates.
- Assigning activity and warranty costs shows the S-100 subsidizing the C-900; total margin changes only by costs newly assigned.
- Action packages (repricing, minimum batch sizes, quality improvement) should be modelled with ranges for uncertain assumptions.
- Savings from freed capacity are real only when resources are redeployed or removed.
- Implementation requires sponsorship, a cross-functional team, a pilot, systems integration, training and annual review.
- Governance safeguards and contract cost rules require consistent, documented methods and separate reporting of unused capacity.
- Cost system redesign
- A structured project to change how an organization measures and assigns costs.
- Parallel run
- Operating a new system alongside the old one to compare results before switching.
- Action package
- A set of coordinated decisions modelled together to estimate their combined effect.
- Cost of unused capacity
- The cost of resources supplied but not used, reported separately from product costs.
- Product-line profitability
- Revenue less the costs traced and assigned to a product line.
- Sensitivity range
- A set of outcomes under different plausible assumptions.
- Methodology governance
- Rules for approving and changing cost methods before results are known.
- Cross-functional team
- A team drawn from several functions, such as accounting, operations and sales.
- Activity data capture
- Collecting driver quantities automatically from operating systems.
- Board report
- A concise report that presents findings and decisions for the board of directors.
Practice problems
Work each problem on paper first, then reveal the answer to check.
Which three symptoms in Halden's diagnosis point to the need for ABC?
Show answer
Ignored product costs in quoting, competitors' prices on simple products, and the C-900's apparent high margin coinciding with falling profit.
Why does total product-line margin fall by exactly $380,000 under the new system?
Show answer
Warranty costs previously treated as period expenses are now assigned; ABC itself only redistributes overhead.
Using the lesson's numbers, what is the C-900's new margin per pump?
Show answer
About −$249,000 ÷ 500 ≈ −$498 per pump.
Name two reasons not to drop the C-900 immediately.
Show answer
Committed engineering and set-up resources; links to municipal customers who buy P-300s; engineering capability.
Why does the controller present a range for the action package?
Show answer
Customer responses to price changes are uncertain.
What must happen for set-up savings to be real?
Show answer
The freed set-up technician must be redeployed or the resource removed.
Why run the new system in parallel for two quarters?
Show answer
To reconcile differences, build trust and catch errors before using the costs for pricing.
How does the redesign affect external reporting?
Show answer
Inventory is still at full absorption cost on normal capacity, but values change; the auditors must accept the new rational, consistent allocation.
Why report unused capacity separately when government contracts exist?
Show answer
So that its cost is not loaded onto any contract, which contract rules and ethics forbid.
List three parts of the board report.
Show answer
Summary of findings and recommendations; product and customer profitability; action package with ranges and implementation plan.
Lesson quiz · 5 questions
Score 60% or more to complete this lesson.
Create a free account to save your progress, take quizzes and earn a certificate.