
STAT-252 · Lesson 6 of 12 · 23 min
Properties of maximum likelihood estimators
Lesson 5 showed how to compute maximum likelihood estimates. This lesson explains why they are trusted. Under regularity conditions that hold for most textbook models, the MLE is consistent, approximately normal in large samples, and asymptotically efficient: no other reasonable estimator has smaller variance in the limit. These results, sketched by Fisher in 1922 and 1925 and made rigorous by Cramér in his 1946 book Mathematical Methods of Statistics, give every MLE an approximate standard error and confidence interval, computed from the curvature of the log-likelihood. They are the reason almost every statistical package reports a standard error next to each estimate.
The score and Fisher information
For one observation with density \(f(x; \theta)\), the score is \(U(\theta) = \frac{\partial}{\partial\theta}\log f(X; \theta)\). Under regularity conditions that allow differentiation under the integral sign, the score has mean zero at the true parameter value:
Its variance is the Fisher information. Differentiating the identity a second time gives an equivalent formula, often easier to compute:
For an iid sample of size \(n\), the scores add, so the information in the sample is \(nI(\theta)\). Information is a measure of how sharply the log-likelihood is expected to curve near the true value, which matches the picture from lesson 5: more data, more curvature, more information.
Standard cases. Bernoulli: \(\log f = x\log p + (1 - x)\log(1 - p)\), second derivative \(-x/p^2 - (1 - x)/(1 - p)^2\), with expected value \(-1/p - 1/(1 - p)\), so \(I(p) = 1/[p(1 - p)]\). Poisson: \(\log f = x\log\lambda - \lambda - \log x!\), second derivative \(-x/\lambda^2\), so \(I(\lambda) = 1/\lambda\). Exponential with rate \(\lambda\): \(\log f = \log\lambda - \lambda x\), so \(I(\lambda) = 1/\lambda^2\). Normal mean with known \(\sigma^2\): \(I(\mu) = 1/\sigma^2\). In each case \(1/(nI)\) turns out to be the variance, or approximate variance, of the MLE.
Consistency
Why should maximizing the likelihood find the true parameter? Divide the log-likelihood by \(n\). By the law of large numbers, \(\frac1n\ell(\theta) \to E_{\theta_0}[\log f(X; \theta)]\) for each \(\theta\), where \(\theta_0\) is the true value. By Jensen's inequality,
with equality only when the two densities agree. The negative of the left side is the Kullback–Leibler divergence of \(f(\cdot; \theta)\) from \(f(\cdot; \theta_0)\). So the limiting average log-likelihood is uniquely maximized at \(\theta_0\), provided the parameter is identifiable, meaning different values give different distributions. Turning this into a proof that \(\hat\theta \to \theta_0\) in probability needs some uniformity of the convergence, which Wald supplied in 1949, but the idea is just this: in the long run, the true parameter fits the data best on average.
Asymptotic normality
Expand the score around the true value. Since \(\ell'(\hat\theta) = 0\),
The numerator is \(n^{-1/2}\) times a sum of iid scores with mean 0 and variance \(I(\theta_0)\), so by the central limit theorem it converges in distribution to \(N(0, I(\theta_0))\). The denominator is an average of iid terms with mean \(I(\theta_0)\), so by the law of large numbers it converges in probability to \(I(\theta_0)\). Slutsky's theorem, which says that if \(Y_n \to Y\) in distribution and \(c_n \to c\) in probability then \(Y_n/c_n \to Y/c\), combines the two:
In words, for large \(n\) the MLE is approximately normal, centered on the truth, with variance \(1/(nI(\theta_0))\). The regularity conditions behind the sketch are that the support does not depend on \(\theta\), the true value is in the interior of \(\Theta\), the log-density has enough continuous derivatives, and the information is finite and positive. The uniform on \([0, \theta]\) fails the first condition, and there the MLE \(X_{(n)}\) converges at rate \(1/n\), not \(1/\sqrt n\), with an exponential limit rather than a normal one.
Standard errors and Wald intervals
The asymptotic variance involves the unknown \(\theta_0\), so in practice it is estimated, either by plugging in, \(1/(nI(\hat\theta))\), or by the observed information \(J(\hat\theta) = -\ell''(\hat\theta)\), the actual curvature of the log-likelihood at its peak. Efron and Hinkley argued in 1978 that the observed information is often the better choice, because it reflects the data actually seen. Either way, the standard error is
and an approximate 95% confidence interval is \(\hat\theta \pm 1.96\,\mathrm{se}(\hat\theta)\), called the Wald interval after Abraham Wald. For a proportion this gives \(\hat p \pm 1.96\sqrt{\hat p(1 - \hat p)/n}\), the familiar interval of introductory courses. Lesson 8 shows that the Wald interval can perform badly when \(n\) is small or the estimate is near a boundary, and lesson 10 gives the likelihood ratio interval, which is usually better.
Worked problem
Standard error of a Poisson rate
A help desk receives 312 calls over 40 one-hour periods. Assuming Poisson counts, find the MLE of the hourly rate, its standard error and an approximate 95% interval.
Show solution
- The MLE is \(\hat\lambda = \bar x = 312/40 = 7.8\) calls per hour.
- Information per observation is \(1/\lambda\), so the variance of \(\hat\lambda\) is approximately \(\lambda/n\), estimated by \(7.8/40 = 0.195\).
- The standard error is \(\sqrt{0.195} \approx 0.442\).
- The Wald interval is \(7.8 \pm 1.96 \times 0.442\), or about 6.93 to 8.67.
Answer: \(\hat\lambda = 7.8\) calls per hour, standard error about 0.44, and an approximate 95% interval from 6.9 to 8.7 calls per hour. Here the observed and expected information agree, since \(-\ell^{\prime\prime}(\hat\lambda) = n\bar x/\hat\lambda^2 = n/\hat\lambda\).
Functions of the MLE
By invariance, \(g(\hat\theta)\) is the MLE of \(g(\theta)\), and the delta method of lesson 4 gives its approximate variance, \(g'(\theta)^2/(nI(\theta))\). For the help desk, the probability of a call-free hour is \(e^{-\lambda}\); its MLE is \(e^{-7.8} \approx 0.00041\), with standard error \(e^{-7.8} \times 0.442 \approx 0.00018\). The same result follows from reparameterizing: information transforms as \(I_\eta(\eta) = I_\theta(\theta)/g'(\theta)^2\) when \(\eta = g(\theta)\). Because the normal approximation is better on some scales than others, intervals are often computed on a transformed scale, such as the log of a rate or the logit of a probability, and transformed back, which keeps them inside the parameter space.
Several parameters
With a parameter vector \(\theta = (\theta_1, \ldots, \theta_k)\), the score is the gradient vector and the Fisher information is the \(k \times k\) matrix with entries \(I_{jk} = -E[\partial^2\log f/\partial\theta_j\partial\theta_k]\). The MLE is asymptotically multivariate normal with covariance matrix \(I(\theta)^{-1}/n\). For the normal model with parameters \(\mu\) and \(\sigma^2\),
so \(\hat\mu\) and \(\hat\sigma^2\) are asymptotically uncorrelated, with variances \(\sigma^2/n\) and \(2\sigma^4/n\). The off-diagonal zero says that not knowing \(\sigma^2\) costs nothing in estimating \(\mu\), in large samples. When the information matrix has non-zero off-diagonal entries, as for the gamma shape and rate, the standard error of one parameter is larger when the other is estimated than when it is known: the correct variance is a diagonal entry of the inverse matrix, not the inverse of a diagonal entry. Ignoring this is a common way to understate uncertainty.
Efficiency
Lesson 7 proves the Cramér–Rao inequality: under the same regularity conditions, any unbiased estimator of \(\theta\) has variance at least \(1/(nI(\theta))\). The MLE attains this bound asymptotically, so in large samples it is as precise as any unbiased estimator can be. This is the sense in which Fisher called the MLE efficient, and it is why the moment estimators of lesson 4 are usually used only as starting values. The asymptotic relative efficiency of an estimator is the ratio \(1/(nI)\) to its asymptotic variance. For the gamma shape with \(\alpha = 2\), the method of moments has asymptotic efficiency of only about 0.58, and it falls further as \(\alpha\) decreases, to about 0.39 at \(\alpha = 1\).
The phrase in large samples hides a subtlety. Joseph Hodges found in 1951 an estimator of a normal mean that equals \(\bar X\) except that it is replaced by 0 whenever \(|\bar X| < n^{-1/4}\). At \(\mu = 0\) its asymptotic variance is zero, beating the bound, and at every other \(\mu\) it matches \(\bar X\). Lucien Le Cam showed in 1953 that such superefficiency can occur only on a set of parameter values of measure zero, and that the price is poor behavior for \(\mu\) near 0 at any fixed \(n\). The modern statement of the MLE's optimality is therefore about estimators that behave regularly near every parameter value, not about each point separately.
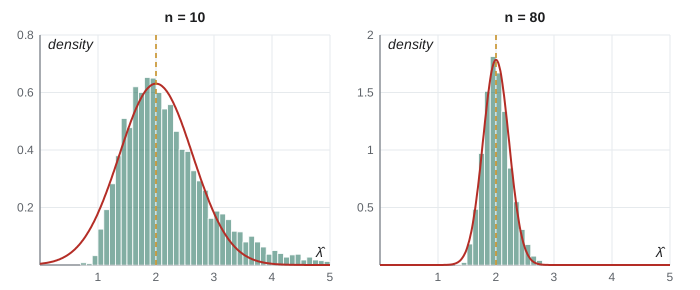
A caution about the word asymptotic. The approximations are limits as \(n \to \infty\); for a particular sample size they may be good or poor. The simulation below shows how close they are for an exponential rate.
import math, random
from statistics import mean, pvariance

rng = random.Random(6)
lam = 2.0
for n in (10, 80):
    mles = [1 / mean(rng.expovariate(lam) for _ in range(n)) for _ in range(4000)]
    crlb = lam ** 2 / n                      # 1 / (n I(lambda)), I = 1 / lambda^2
    print(f"n = {n:2d}: mean MLE {mean(mles):.3f}, var {pvariance(mles):.4f}, "
          f"1/(nI) {crlb:.4f}, ratio {pvariance(mles) / crlb:.2f}")

# coverage of the Wald interval  lambda-hat +/- 1.96 lambda-hat / sqrt(n)
for n in (10, 80):
    low = high = 0
    for _ in range(4000):
        lh = 1 / mean(rng.expovariate(lam) for _ in range(n))
        se = lh / math.sqrt(n)
        low += lam < lh - 1.96 * se          # interval entirely above the truth
        high += lam > lh + 1.96 * se         # interval entirely below the truth
    print(f"n = {n:2d}: Wald coverage {1 - (low + high) / 4000:.3f}, "
          f"misses above {low / 4000:.3f}, below {high / 4000:.3f}")

# help desk example
n, total = 40, 312
lh = total / n; se = math.sqrt(lh / n)
print(f"help desk: rate {lh:.2f}, se {se:.3f}, interval {lh - 1.96 * se:.2f} to {lh + 1.96 * se:.2f}")
print(f"P(no calls) MLE {math.exp(-lh):.5f}, delta-method se {math.exp(-lh) * se:.5f}")n = 10: mean MLE 2.230, var 0.6197, 1/(nI) 0.4000, ratio 1.55 n = 80: mean MLE 2.018, var 0.0529, 1/(nI) 0.0500, ratio 1.06 n = 10: Wald coverage 0.958, misses above 0.005, below 0.037 n = 80: Wald coverage 0.954, misses above 0.019, below 0.027 help desk: rate 7.80, se 0.442, interval 6.93 to 8.67 P(no calls) MLE 0.00041, delta-method se 0.00018
With 10 observations, the MLE of the rate is noticeably biased upward and its variance is well above \(1/(nI)\), since \(1/\bar X\) has a right-skewed distribution; the Wald interval's overall coverage happens to be close to 95%, but its misses are lopsided, falling mostly on one side of the truth, so its two tails are not the 2.5% each that a 95% interval promises. With 80 observations, the bias is small, the variance ratio is close to 1 and the misses are more evenly split. This pattern is typical: asymptotic results are reliable for moderate samples in well-behaved models, and checking them by simulation, as here, is cheap and good practice.
When the model is wrong
All of these results assume the model is correct. In practice it is at best an approximation, and the MLE then converges to the parameter value whose distribution is closest to the truth in Kullback–Leibler divergence, by the same Jensen argument used for consistency. Peter Huber showed in 1967 that the MLE is still asymptotically normal in this case, but its variance is no longer \(1/(nI)\). The correct variance has the sandwich form \(A^{-1}BA^{-1}/n\), where \(A\) is minus the expected second derivative of the log-density and \(B\) is the variance of the score, both computed under the true distribution. When the model is right, \(A = B = I\) and the sandwich collapses to the usual formula. Halbert White popularized the estimated version for regression in 1980 and 1982, and it is the source of the robust standard errors reported by econometrics software. A large gap between model-based and sandwich standard errors is a useful sign that the model is missing something, such as overdispersion in count data, where the Poisson variance \(\lambda\) is smaller than the actual variance.
Common mistakes
MistakeUsing the inverse of a diagonal entry of the information matrix as a variance.
InsteadThe variance of \(\hat\theta_j\) is the \(j\)th diagonal entry of \(I^{-1}/n\), which accounts for the other estimated parameters.
MistakeApplying the \(1/\sqrt n\) normal theory when the support depends on \(\theta\).
InsteadFor the uniform, the MLE converges at rate \(1/n\) to a non-normal limit; the regularity conditions fail.
MistakeForgetting that the information for \(n\) observations is \(nI(\theta)\).
Instead\(I(\theta)\) is information per observation; the sample information grows linearly in \(n\).
MistakeTrusting asymptotic standard errors in very small samples.
InsteadCheck by simulation, use a better scale (log or logit), or use the likelihood ratio interval of lesson 10.
MistakeConfusing consistency with unbiasedness.
InsteadA consistent estimator converges to the truth as \(n\) grows; it may be biased for every finite \(n\), as \(1/\bar X\) is.
Summary and key terms
- The score has mean zero, and its variance is the Fisher information \(I(\theta) = -E[\partial^2\log f/\partial\theta^2]\).
- The MLE is consistent because the true parameter maximizes the expected log-likelihood (Jensen’s inequality).
- Asymptotically, \(\sqrt n(\hat\theta - \theta) \to N(0, 1/I(\theta))\), by a Taylor expansion, the central limit theorem and Slutsky’s theorem.
- Standard errors come from expected or observed information; Wald intervals are \(\hat\theta \pm 1.96\,\mathrm{se}\).
- With several parameters, the asymptotic covariance is \(I(\theta)^{-1}/n\).
- The MLE is asymptotically efficient, attaining the Cramér–Rao bound in the limit.
- Fisher information
- \(I(\theta) = \mathrm{Var}[U(\theta)] = -E[\ell^{\prime\prime}(\theta)]\) for one observation.
- observed information
- \(J(\hat\theta) = -\ell^{\prime\prime}(\hat\theta)\), the curvature of the log-likelihood at its maximum.
- consistency
- Convergence of an estimator in probability to the true parameter.
- asymptotic normality
- Approximate normality of a suitably scaled estimator in large samples.
- Slutsky’s theorem
- Limits in distribution and in probability can be combined by sums, products and ratios.
- Wald interval
- \(\hat\theta \pm z\,\mathrm{se}(\hat\theta)\).
- identifiability
- Different parameter values give different distributions.
Practice problems
Work each problem on paper first, then reveal the answer to check.
Find the Fisher information for the geometric distribution \(f(x; p) = p(1 - p)^{x-1}\).
Show answer
\(\log f = \log p + (x - 1)\log(1 - p)\); the second derivative is \(-1/p^2 - (x - 1)/(1 - p)^2\); with \(E[X] = 1/p\), \(I(p) = 1/p^2 + 1/[p(1 - p)] = 1/[p^2(1 - p)]\).
In 200 trials there are 46 successes. Give the MLE of \(p\), its standard error and a Wald 95% interval.
Show answer
\(\hat p = 0.23\), se \(= \sqrt{0.23 \times 0.77/200} \approx 0.0298\), interval about 0.172 to 0.288.
For the exponential rate, show that observed and expected information agree at \(\hat\lambda\).
Show answer
\(\ell^{\prime\prime} = -n/\lambda^2\) does not depend on the data, so \(J(\hat\lambda) = n/\hat\lambda^2 = nI(\hat\lambda)\).
Use the delta method to find the approximate standard error of \(\log\hat\lambda\) for a Poisson rate.
Show answer
\(g^{\prime}(\lambda) = 1/\lambda\), so the variance is \((1/\lambda^2)(\lambda/n) = 1/(n\lambda)\), and se \(\approx 1/\sqrt{n\hat\lambda} = 1/\sqrt{\sum x_i}\).
Why is the normal approximation for \(\hat p\) poor when \(n = 20\) and \(\hat p = 0.05\)?
Show answer
The sampling distribution is very skewed near the boundary 0, and the estimated se uses an unstable \(\hat p\); the Wald interval can even extend below zero.
For the normal model, what is the asymptotic variance of \(\hat\sigma\), the MLE of the standard deviation?
Show answer
By the delta method with \(g(v) = \sqrt v\), \(g^{\prime} = 1/(2\sigma)\), so the variance is \((2\sigma^4/n)/(4\sigma^2) = \sigma^2/(2n)\).
Lesson quiz · 5 questions
Score 60% or more to complete this lesson.
Create a free account to save your progress, take quizzes and earn a certificate.