
SLS-212 · Lesson 6 of 12 · 20 min
Using visuals and data
▶ Video coming soon A video version of this lesson is on the way.
Grace Liu, Ridgeline's sales operations analyst, came to the Friday presentation lab on October 2, 2026 with a folder of charts. Each one had been used in a real Ridgeline presentation over the previous year, and each one had something wrong with it. One had a vertical axis that started at 90 instead of zero, making a two-point difference look like a cliff. One used eight colors that were impossible to tell apart on a projector. One showed a three-dimensional pie chart in which the front slice looked twice the size of an equal slice at the back. "Every one of these was made by someone trying to help," Grace said. "And every one of them made the customer trust us a little less, or understand a little less, or both."
Visuals and data are among the most persuasive parts of a sales presentation and among the easiest to get wrong. This lesson covers when to use a visual, how to choose and design charts, how to present numbers honestly, and how to design slides that support the speaker rather than replace them.
When a visual helps
A visual helps when it shows something faster or more clearly than words can: a comparison, a trend, a process, a layout or a physical object. It does not help when it decorates a point that words already make, or when it shows more detail than the audience can absorb. Richard Mayer's research on multimedia learning, summarized in his book *Multimedia Learning* (2001, with later editions), found that people generally learn better from words and relevant pictures together than from words alone, but that extra, irrelevant material, which he called extraneous content, makes learning worse. Decorative photographs and clip art are extraneous; a chart that shows the customer's costs falling is not.
| To show... | Use... | Avoid... |
|---|---|---|
| A comparison between a few items | Bar chart | Pie chart with many slices; three-dimensional effects |
| A change over time | Line chart | Bars for many time periods; dual axes |
| Parts of a whole (two or three parts) | Simple bar or a single stacked bar | Pie charts with more than three slices |
| A process or sequence | A flow diagram with a few boxes | Dense diagrams with every exception |
| A physical layout | A floor plan or photograph | Text descriptions of space |
| A single important number | The number, large, with a short label | A chart for one number |
Designing an honest chart
Edward Tufte, whose book *The Visual Display of Quantitative Information* (1983) remains one of the most cited works on data graphics, argued that a chart should show the data clearly and avoid what he called chartjunk: decoration that adds nothing to understanding. He also proposed the lie factor, the ratio between the size of an effect as shown in a graphic and its size in the data. A lie factor of 1 means the graphic is faithful; much larger values mean it exaggerates.
The most common way sales charts exaggerate is a truncated axis. A bar chart's bars represent quantities by their length, so a bar chart must start at zero; otherwise, a small difference looks large. Line charts can sometimes start above zero when the purpose is to show change over time, but the axis should be clearly labeled and the choice should not create a false impression.
Worked problem
Calculating the distortion from a truncated axis
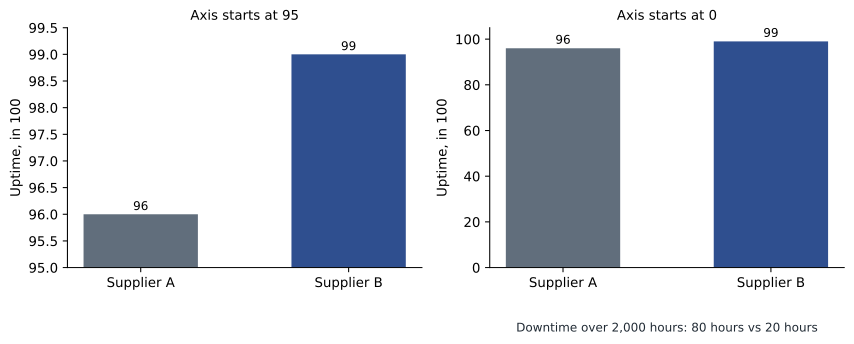
A competitor's brochure shows uptime of 96 in 100 for its printers and 99 in 100 for its own, in a bar chart whose axis starts at 95. How much longer does the 99 bar look than the 96 bar, and what is the actual ratio? What is the lie factor?
Show solution
- On an axis starting at 95, the visible bar lengths are 99 − 95 = 4 and 96 − 95 = 1.
- Visually, the 99 bar looks 4 ÷ 1 = 4 times as long as the 96 bar.
- The actual ratio is 99 ÷ 96 = about 1.031, so the real difference is about 3 in 100.
- Lie factor, using Tufte's definition (size of effect shown ÷ size of effect in data): the effect shown is a 300 in 100 increase (from 1 to 4); the effect in the data is about 3.1 in 100. 300 ÷ 3.125 = 96.
Answer: The chart makes one bar look four times as long as the other when the real difference is about 3 in 100, a lie factor of about 96. A bar chart starting at zero would show two bars of almost equal length.
Truncating an axis is not always dishonest; sometimes a small difference matters, as with uptime. But the honest way to show that is to say so, label the numbers clearly, and perhaps show the difference in hours: at 96 in 100 uptime, a printer used for 2,000 hours a year is down for 80 hours; at 99 in 100, for 20 hours. That comparison makes the point more strongly than any distorted bar, and it is true.
Making charts readable
Beyond honesty, a chart in a presentation has to be readable from the back of the room or on a laptop screen. Grace's guidelines for Ridgeline's sellers were short.
| Guideline | Reason |
|---|---|
| One message per chart, stated in the title | The title "Device fees fall from 5,050 to 3,700 dollars a month" tells the audience what to see; "Device fees" does not |
| Label data directly instead of using a legend | The eye does not have to travel back and forth |
| Use one accent color for the item that matters, gray for the rest | It shows the audience where to look |
| Avoid relying on color alone | About 1 in 12 men and 1 in 200 women have some color vision deficiency |
| Round numbers sensibly | 5,050 dollars, not 5,049.87 |
| Remove gridlines, borders and effects that carry no information | Less clutter, clearer data |
The color vision figures come from long-standing population studies of red-green color vision deficiency in people of northern European ancestry; rates vary in other populations. The practical point is the same everywhere: a chart that uses only red and green to mark good and bad will be unreadable to some of the audience, so add labels, shapes or patterns.
Presenting numbers
Numbers are persuasive only if the audience understands them and trusts them. Several habits help with both.
First, use the customer's numbers wherever possible. Prairie Valley's own audit numbers, collected with its IT staff, carried more weight than any Ridgeline estimate. Second, make large numbers concrete. "Device fees fall by 1,350 dollars a month" is easier to grasp when it is followed by "that is 16,200 dollars a year, or about 81,000 dollars over the five-year contract". Third, show the calculation behind important numbers, at least in the written proposal, so that finance staff can check it. Fourth, be clear about what is measured and what is estimated, and say where estimates come from.
Worked problem
Checking the numbers before they go on a slide
Maya's draft slide for Prairie Valley says: "61 devices down to 44: a 28 percent reduction. Device fees down from 5,050 to 3,700 dollars a month: savings of 16,200 dollars a year." Check both figures.
Show solution
- Reduction in devices: 61 − 44 = 17. As a share of 61: 17 ÷ 61 = 0.2787, or about 28 in 100. The slide is correct.
- Monthly saving in device fees: 5,050 − 3,700 = 1,350 dollars.
- Annual saving: 1,350 × 12 = 16,200 dollars. The slide is correct.
- Check the claim's scope: these are device fees only, not total print cost, which also includes service and supplies. The slide should say "device fees" clearly so no one mistakes it for the total saving.
Answer: Both numbers are right: 17 fewer devices is about 28 in 100, and device fees fall by 16,200 dollars a year. The slide needs to make clear that this is device fees, not total cost.
That last step, checking the scope of a claim, is where many honest presenters go wrong. A number can be arithmetically correct and still mislead if it is presented as something it is not. Device fees falling by 16,200 dollars a year does not mean the division's total print bill falls by 16,200 dollars; the total also depends on page volumes, service and supplies. Lesson 9 shows how the full business case was built.
Slides that support the speaker
Many sales slides are written as documents: full sentences, bullet points covering every detail, small text. The presenter then reads them aloud, and the audience reads ahead and stops listening. Research on the redundancy principle in Mayer's work found that presenting the same words as spoken narration and on-screen text at the same time tends to reduce learning compared with narration plus a relevant graphic, because the audience processes the words twice.
Farida's approach, which many presentation coaches share, was to separate the slides from the document. Slides carry a headline that states the point, a visual or a few key words, and nothing the presenter will read aloud word for word. The detail goes in the written proposal or a leave-behind document. This lets the slides be large and simple, and it means the audience listens to the speaker.
| Document slide | Presentation slide |
|---|---|
| Title: "Service and support" | Headline: "One call fixes any printer, in four business hours" |
| Eight bullet points describing the service desk, hours, escalation and loaners | A simple diagram: school calls one number, technician arrives, loaner if needed |
| Text in 14-point type | Text in 28-point type or larger |
| Presenter reads the bullets | Presenter explains; detail is in the written response |
Some customers, especially in procurement, want the slides sent afterward as a record. In that case, send a short written summary or the proposal itself rather than slides that make no sense without the speaker. If slides must be sent, add speaker notes or a one-page summary.
Using AI tools to make visuals
By 2026, most presentation software included AI features that could draft slides, suggest charts and generate images. These tools save time, but they need careful checking. A drafted chart may choose a misleading chart type or a truncated axis. A generated image may show a product that does not look like the real one, which can mislead a customer about what they are buying. Data pasted into an online AI tool may leave the company's control, which can breach confidentiality agreements or privacy law if it includes customer information. Ridgeline's policy, set by Grace and Leah Marchand, was that AI tools could be used only through the company's approved account, never with customer data that had not been anonymized, and that every chart and image had to be checked by the seller before use.
Tables or charts?
Not every set of numbers needs a chart. When the audience needs exact values, such as the prices in a set of options or the device counts for each school, a small, clean table is often better. When the audience needs to see a pattern, such as a trend or a comparison of sizes, a chart is better. A useful rule is to ask what the audience will do with the numbers. If they will look something up, use a table; if they will compare or notice a shape, use a chart. Tables on slides should be short, with large text and only the rows that matter; long tables belong in the written proposal.
Common mistakes
MistakeStarting a bar chart's axis above zero.
InsteadStart bars at zero; if a small difference matters, explain it in concrete terms.
MistakeUsing decorative images and three-dimensional effects.
InsteadUse visuals only when they show something faster than words; remove chartjunk.
MistakeRelying on red and green to show good and bad.
InsteadAdd labels, shapes or patterns so color is not the only signal.
MistakePresenting a correct number with the wrong scope.
InsteadSay exactly what a number covers, such as device fees versus total cost.
MistakePutting paragraphs on slides and reading them aloud.
InsteadUse a headline and a visual; put the detail in the written proposal.
Summary and key terms
- Use a visual when it shows a comparison, trend, process, layout or key number faster than words; leave out decoration.
- Match the chart to the message: bars for comparisons, lines for trends, few-part bars instead of busy pie charts.
- Tufte's lie factor compares the size of an effect shown with the size in the data; truncated bar axes produce large lie factors.
- If a small difference matters, show it honestly in concrete terms, such as hours of downtime.
- Readable charts have one message stated in the title, direct labels, one accent color and no reliance on color alone.
- Use the customer's numbers, make large numbers concrete, show the calculation and be precise about scope.
- Presentation slides should support the speaker with a headline and a visual, while detail goes in the written proposal.
- Check AI-made visuals and keep customer data out of unapproved tools.
- Chartjunk
- Tufte's term for decoration in a chart that adds nothing to understanding.
- Lie factor
- The size of an effect shown in a graphic divided by its size in the data.
- Truncated axis
- A chart axis that starts above zero, which can exaggerate differences in bar charts.
- Redundancy principle
- Mayer's finding that showing the same words on screen while speaking them tends to reduce learning.
- Direct labeling
- Putting labels next to data rather than in a separate legend.
- Leave-behind
- A written document given after a presentation that carries the detail the slides leave out.
Practice problems
Work each problem on paper first, then reveal the answer to check.
A bar chart shows 80 and 84 with an axis starting at 78. How many times longer does the 84 bar look?
Show answer
Visible lengths are 84 − 78 = 6 and 80 − 78 = 2, so 3 times as long, although the real ratio is 84 ÷ 80 = 1.05.
A printer used 1,500 hours a year has uptime of 98 in 100. How many hours is it down?
Show answer
1,500 × 0.02 = 30 hours a year.
Write a chart title that states the message for a chart of device fees falling from 5,050 to 3,700 dollars a month.
Show answer
For example: "Device fees fall from 5,050 to 3,700 dollars a month."
Lesson quiz · 5 questions
Score 60% or more to complete this lesson.
Create a free account to save your progress, take quizzes and earn a certificate.