
PHYS-397 · Lesson 12 of 12 · 22 min
Capstone: writing up results — the lab report, the paper and peer review
An experiment is not finished until it is written up. A result that exists only in your notebook cannot be checked, built on or used, and the act of writing it up is often where you discover what you actually found and what you still do not understand. This capstone lesson brings the course together around the written report. We look at the structure shared by laboratory reports and research papers, at how to present numbers, uncertainties, figures and tables, at how to compare a result with theory or an accepted value, and at how scientific papers are reviewed and published. The running example is a report on the pendulum measurement of \(g\) from lessons 1 to 3, but the same principles apply to a thesis chapter or a paper in a journal.
Who is the reader?
Write for a reader who is a competent physicist but was not in the room: a fellow student, an instructor, a referee, or yourself in a year's time. That reader needs to understand what question you asked, how you answered it, what you found, how sure you are and why it matters, and should be able to repeat the experiment from your description. They will read the title and abstract, look at the figures, read the conclusion and only then, if interested, read the rest. Structure the report so that each of these entry points works on its own.
The structure of a report
Physics reports and papers follow a common structure, often summarized as introduction, methods, results and discussion. The abstract, a single paragraph of 100 to 200 words, states the aim, the method in one sentence, the main result with its uncertainty, and the main conclusion. It is written last. The introduction explains the physics and the question, cites previous work, and ends by saying what this experiment does. The method, or experimental section, describes the apparatus and procedure precisely enough for someone else to repeat it, including the instruments used, their settings and their uncertainties, and how the data were taken; it should mention decisions such as data rejection criteria. The results section presents the data and the analysis that turns raw measurements into the final quantities, with figures and tables, the fits and their goodness of fit, and the uncertainty budget. The discussion interprets the results: does the measurement agree with theory or an accepted value, what are the dominant uncertainties, what systematic effects were considered and how could the experiment be improved? A brief conclusion restates the main result. References list every source cited, in a consistent style. Appendices hold long derivations, raw data tables or code.
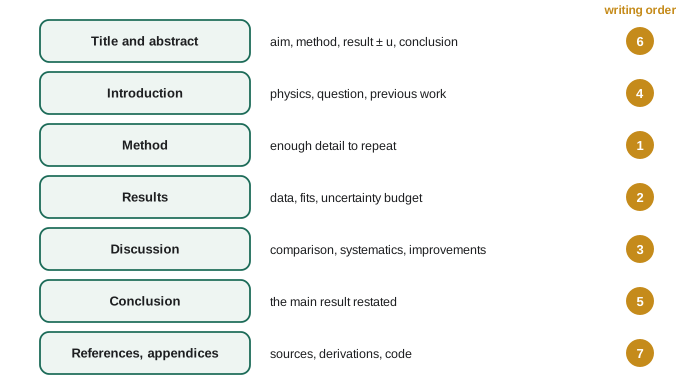
It helps to write in a different order from the one in which the report is read. The method and results are the easiest to write, because they describe what you did and found; write them first, while the details are fresh. The discussion follows from the results. The introduction is easier once you know what the report has to introduce. The abstract and title come last, because they summarize everything.
Numbers and uncertainties
Every measured result must carry an uncertainty and a unit, and the number of digits must match the uncertainty. The usual convention is to round the uncertainty to one significant figure, or two if its first digit is 1, 2 or 3 (rounding 0.14 to 0.1 would change it by almost 30 parts in 100), and then to round the value to the same decimal place. So \(9.80673 \pm 0.01183\ \text{m/s}^2\) is written \(9.807 \pm 0.012\ \text{m/s}^2\), and \(632.91 \pm 3.73\) nm becomes \(633 \pm 4\) nm. For very large or small numbers, use scientific notation with the value and its uncertainty sharing the same power of ten, \((6.73 \pm 0.13) \times 10^{-34}\) J s. Keep extra digits in intermediate calculations to avoid rounding errors; round only the reported result. State what the uncertainty means: a standard uncertainty, of about 68 chances in 100, unless you say otherwise. When random and systematic contributions are comparable, give them separately.
Comparing with expectations
A result is usually compared with a theory, an accepted value or another measurement. The comparison is made in units of the combined uncertainty. If the result is \(x \pm u\) and the reference is \(x_0 \pm u_0\), compute
For normally distributed errors, \(|z| < 1\) happens about two times in three, \(|z| < 2\) about 95 times in 100. A value of \(|z|\) up to about 2 is consistent; between 2 and 3 is a tension worth discussing; above 3 almost certainly indicates an unrecognized systematic error, or new physics, and the report should say which possibilities were checked. Do not write that a result is wrong because it differs from the textbook by 2 parts in 1000 if its uncertainty is 3 parts in 1000; and do not write that it agrees if its uncertainty was inflated to make it agree. Never use a bare fractional difference as a substitute for this comparison: a 1 part in 100 difference is excellent for one experiment and a failure for another, depending on the uncertainty.
import math
# 1. Quote a result with its uncertainty: round the uncertainty to 1 or 2 significant figures, then the value to match.
def quote(x, u, unit):
    exp = math.floor(math.log10(u))
    lead = u/10**exp
    sig = 2 if lead < 3.5 else 1                     # keep two figures when the uncertainty starts with 1, 2 or 3
    dec = -(exp - sig + 1)
    ur = round(u, dec); xr = round(x, dec)
    fmtd = f"{{:.{max(dec, 0)}f}}"
    return f"{fmtd.format(xr)} +/- {fmtd.format(ur)} {unit}".rstrip()
for x, u, unit in ((9.80673, 0.01183, "m/s^2"), (6.7327e-34, 1.3e-35, "J s"), (1.60251e-19, 4.4e-22, "C"), (632.91, 3.73, "nm"), (1.09651e7, 1.5e3, "1/m")):
    if abs(x) < 1e-3 or abs(x) > 1e5:
        p = math.floor(math.log10(abs(x)))
        print(f"({quote(x/10**p, u/10**p, '')}) x 10^{p} {unit}")
    else:
        print(quote(x, u, unit))
# 2. Compare a result with an accepted value: the discrepancy in units of the combined uncertainty.
for name, x, u, ref, uref in (("g in the lab", 9.8067, 0.0118, 9.8066, 0.0001), ("Planck constant", 6.7327e-34, 1.3e-35, 6.62607015e-34, 0.0), ("Rydberg constant", 1.09651e7, 1.5e3, 1.09678e7, 0.0)):
    z = (x - ref)/math.hypot(u, uref)
    print(f"{name:17s}: discrepancy {z:+.2f} standard uncertainties -> {'consistent' if abs(z) < 2 else 'tension, look for a systematic effect'}")
# 3. A word budget for a six-page lab paper (about 3000 words) and the share each section usually takes.
budget = {"abstract": 150, "introduction": 450, "method": 650, "results": 700, "discussion": 750, "conclusion": 150, "references and figure captions": 150}
total = sum(budget.values())
for k, v in budget.items(): print(f"  {k:31s} {v:4d} words  {v/total*100:4.1f} of every 100")
print(f" total {total} words")9.807 +/- 0.012 m/s^2 (6.73 +/- 0.13) x 10^-34 J s (1.603 +/- 0.004) x 10^-19 C 633 +/- 4 nm (1.09651 +/- 0.00015) x 10^7 1/m g in the lab : discrepancy +0.01 standard uncertainties -> consistent Planck constant : discrepancy +0.82 standard uncertainties -> consistent Rydberg constant : discrepancy -1.80 standard uncertainties -> consistent abstract 150 words 5.0 of every 100 introduction 450 words 15.0 of every 100 method 650 words 21.7 of every 100 results 700 words 23.3 of every 100 discussion 750 words 25.0 of every 100 conclusion 150 words 5.0 of every 100 references and figure captions 150 words 5.0 of every 100 total 3000 words
The program rounds the main results of this course to their uncertainties and compares three of them with reference values. The laboratory value of \(g\), from a careful amplitude-corrected pendulum measurement, agrees with a local reference value to a hundredth of its uncertainty. The photoelectric \(h\) from lesson 9 is 0.8 standard uncertainties from the exact value. The Rydberg constant from the grating, with a total uncertainty of \(1.5 \times 10^3\) m\(^{-1}\), is 1.8 standard uncertainties low: consistent, but close enough to the boundary that a report should mention the calibration of the grating spacing as the most likely source if further runs confirmed the difference. The word budget is a planning tool rather than a rule; discussions often grow when results are surprising.
Figures and tables
A good figure is often the most important part of a report. Each figure should make one point. Label the axes with the quantity and its unit, for example period \(T\) (s). Show error bars, and say in the caption what they represent. Plot data as points and models as lines, so the reader can tell them apart. Choose axes that make the relationship clear, for example a log-log plot for a power law, or a linear plot of a quantity that the theory predicts is linear in the plotted variable. Show residuals below a fit. The caption should be complete enough to understand the figure without reading the text. Tables are better than figures for precise values that the reader may want to use; give units in the column headings and uncertainties in each entry or column. Never include a figure or table without referring to it in the text and saying what it shows.
Writing well
Clarity matters more than style. Use short paragraphs, each with a single main idea stated near its start. Prefer the active voice where it is clearer: we measured the period is plainer than the period was measured, though both are acceptable in physics. Define every symbol when it first appears. Use equations for relations, numbered if they are referred to later, and punctuate them as part of the sentence. Avoid vague words like approximately correct; give the number. Do not pad: say what you need to and stop. Read the draft aloud, or ask someone else to read it, and cut what does not help. Use a consistent citation style, and cite the sources of every value and equation you did not derive yourself. Most physics papers are now written in LaTeX, a typesetting system that handles equations, numbering and references well; it is worth learning.
Peer review and publication
Research papers are submitted to a journal, whose editor sends them to one or more referees, experts who read the paper critically and report on whether its claims are supported, whether the methods are sound and whether it is clear and significant. The authors respond to the referees' comments, revise the paper, and the editor decides whether to publish. Peer review is not a guarantee of truth, as several episodes in this course have shown, but it catches many errors and improves most papers. In physics, most papers are also posted as preprints on the arXiv server, started by Paul Ginsparg at Los Alamos in 1991, before or alongside journal submission, so that results circulate quickly and can be discussed openly. After publication, errors are corrected through errata, comments and, when necessary, retractions. Reading referee reports, and later writing them, is part of learning the craft: a good referee report is specific, fair and constructive, and distinguishes serious problems from matters of taste.
Looking back
This course began with a pendulum and a stopwatch and ends with a report. In between, you have designed experiments with controls and scaling in mind, propagated uncertainties analytically and by Monte Carlo, fitted models and tested them with chi-squared, understood how instruments load circuits and how amplifiers, filters and lock-ins handle signals and noise, avoided aliasing, worked through the classic experiments that established the electron, the photon and the quantized atom, and considered the safety and integrity on which all experimental work depends. The habits that tie it together are the ones Millikan, Michelson, Franck and Hertz had to learn too: understand your apparatus, quantify your uncertainty, look hard for what could fool you, and report honestly what you found.
Worked problem
Writing the abstract for the pendulum report
Write a 100-word abstract for a report on measuring g with a simple pendulum, with a final result of \(9.807 \pm 0.012\ \text{m/s}^2\) after an amplitude correction.
Show solution
- Aim and method: We measured the gravitational acceleration with a 0.800 m simple pendulum, timing 50 swings with a stopwatch at an amplitude of 10 degrees.
- Key correction: The finite-amplitude correction, 1.9 parts in 1000, was applied using the exact period.
- Result: We obtain \(g = 9.807 \pm 0.012\ \text{m/s}^2\), dominated by the uncertainty of the length.
- Comparison and conclusion: This agrees with the local reference value of 9.8066 m/s\(^2\) within 0.1 standard uncertainties; a better length measurement is the main route to improvement.
Answer: We measured the gravitational acceleration with a 0.800 m simple pendulum, timing 50 swings with a stopwatch at an amplitude of 10 degrees. Applying the finite-amplitude correction of 1.9 parts in 1000, we obtain \(g = 9.807 \pm 0.012\ \text{m/s}^2\). The uncertainty is dominated by the length measurement. The result agrees with the local reference value within 0.1 standard uncertainties. Without the correction, the result would have been biased low by about 3 standard uncertainties, showing that a precise measurement requires a model that includes every effect larger than its random error.
Common mistakes
MistakeQuoting more digits than the uncertainty justifies.
InsteadRound the uncertainty to one or two figures and the value to the same place.
MistakeComparing results by their fractional difference alone.
InsteadExpress the difference in units of the combined uncertainty.
MistakeWriting the abstract first.
InsteadWrite it last, when you know what the report says.
MistakeFigures without units, error bars or captions.
InsteadLabel every axis with quantity and unit; explain the error bars in the caption.
MistakeLeaving out the runs that failed or the data that were rejected.
InsteadReport what was done, including rejection criteria, so the reader can judge.
Summary and key terms
- Write for a competent reader who was not there; make the title, abstract, figures and conclusion work on their own.
- Structure: abstract, introduction, method, results, discussion, conclusion, references; write the abstract last.
- Round uncertainties to one or two figures and values to match; give units and say what the uncertainty means.
- Compare with references using \(z = (x - x_0)/\sqrt{u^2 + u_0^2}\).
- Figures make one point each, with labeled axes, error bars, residuals and complete captions.
- Peer review and preprints spread and check results; errors are corrected openly.
- abstract
- A one-paragraph summary of aim, method, result and conclusion.
- significant figures
- The digits of a number that carry meaning, set by its uncertainty.
- discrepancy
- The difference between two values, expressed in units of their combined uncertainty.
- peer review
- Evaluation of a paper by independent experts before publication.
- preprint
- A version of a paper shared publicly before or during peer review.
- erratum
- A published correction to an error in a paper.
Practice problems
Work each problem on paper first, then reveal the answer to check.
Round \(2.34567 \pm 0.0472\) correctly.
Show answer
\(2.35 \pm 0.05\).
Round \(15{,}832 \pm 147\) correctly.
Show answer
\(15{,}830 \pm 150\), or \((1.583 \pm 0.015) \times 10^4\).
A measured value is \(299{,}700 \pm 80\) km/s. How many standard uncertainties is it from 299,792 km/s?
Show answer
\(z = -92/80 = -1.15\): consistent.
A result of \(1.651 \pm 0.004\) is compared with \(1.640 \pm 0.002\). What should the report say?
Show answer
\(z = 0.011/0.0045 = 2.5\): a tension worth discussing, with the systematic checks that were made.
What belongs in the method section of a report on the e/m experiment?
Show answer
The apparatus, coil dimensions and turns, instruments and their uncertainties, the voltages and currents used, how the radius was measured, and how the Earth's field was handled.
Why do physicists post preprints on the arXiv?
Show answer
To share results quickly and openly, before or alongside the slower journal review.
Lesson quiz · 5 questions
Score 60% or more to complete this lesson.
Create a free account to save your progress, take quizzes and earn a certificate.