
PET-460 · Lesson 8 of 12 · 20 min
Storage capacity and injectivity
Lena's question was blunt. “Seventy-five million metric tons over twenty-five years, three million a year. Can the hub area take it, and how many wells does it need?” Ethan knew the answer had two parts that are easy to confuse. Capacity is how much CO₂ the formation can hold; injectivity is how fast wells can put it there. A formation can have enormous capacity and still be a poor site because each well takes only a little CO₂ before pressure reaches its limit, and a highly permeable formation can take CO₂ quickly but fill its legal boundary in a decade. The study had to show both, with ranges.
How capacity is classified
Storage estimates are described with a resource pyramid similar to the petroleum one. Theoretical capacity is the whole pore volume that could physically hold CO₂. Effective capacity applies geological and engineering limits, such as how much of the pore volume a plume can actually contact. Practical capacity adds economic, regulatory and infrastructure limits. Matched capacity pairs storage with real sources and pipelines. The Society of Petroleum Engineers' Storage Resources Management System (SRMS), published in 2017, applies the familiar reserves logic to storage: a project with a defined development plan, permits and commercial commitment can book capacity, which is classified by maturity and uncertainty as low, best and high estimates, like proved, probable and possible reserves.
The efficiency-factor method
For saline formations at the regional and screening stage, the US Department of Energy method is the most widely used. It multiplies the bulk pore volume of the formation by the CO₂ density and a storage efficiency factor:
Here A is the area, h_g the gross thickness, φ_tot the total porosity, ρ_CO₂ the CO₂ density at reservoir conditions and E the efficiency factor. E combines the fractions of the area and thickness that are suitable, the fraction of porosity that is effective, and the displacement efficiencies: how much of the pore volume within the plume's reach CO₂ actually contacts, given buoyancy, heterogeneity and viscous fingering, and how much of each contacted pore it fills, given residual brine. From Monte Carlo analysis of those factors, the DOE gives formation-scale values for clastic formations of about 0.5 percent at P10, 2.0 percent at P50 and 5.5 percent at P90, and somewhat different values for carbonates. If the net thickness and effective porosity are known, higher site-specific factors apply. The point of the method is not precision but honesty about the range: a P10 to P90 spread of a factor of ten is typical before any injection data exist.
# Storage capacity of the hub area (DOE efficiency-factor method and a closed-volume pressure limit)
# and injectivity: how many wells the hub needs.
import math
SI = False     # True: Canadian hub (Basal Cambrian), metric; False: US hub (Frio), US units

if SI: P = dict(area_km2=800, h=45.0, phi=0.16, rho=704.0, ct=1.2e-9, dp=12.7e6, k=250, mu_c=6.0e-5, krc=0.35, tubing=1.0)
else:  P = dict(area_km2=600, h=45.7, phi=0.26, rho=573.0, ct=1.2e-9, dp=7.9e6, k=300, mu_c=5.0e-5, krc=0.35, tubing=1.0)
need = 3.0 * 25                               # Mt over the project life
A = P['area_km2'] * 1e6
pore = A * P['h'] * P['phi']
if SI: print(f"Area {P['area_km2']} km2, net {P['h']:.0f} m, porosity {P['phi']:.2f}: pore volume {pore / 1e9:.2f} billion m3")
else:  print(f"Area {P['area_km2'] / 2.59:.0f} mi2, net {P['h'] * 3.281:.0f} ft, porosity {P['phi']:.2f}: pore volume {pore * 6.2898 / 1e9:.1f} billion bbl")
print(f"CO2 density at reservoir conditions {P['rho']:.0f} kg/m3 ({P['rho'] / 16.0185:.1f} lb/ft3)")
print("DOE efficiency factors for clastic saline formations (formation scale):")
for lab, E in (("P10", 0.0051), ("P50", 0.020), ("P90", 0.055)):
    G = pore * P['rho'] * E / 1e9
    print(f"  {lab}: E = {E:.2%}  capacity {G:6.0f} Mt   {'covers' if G >= need else 'short of'} the {need:.0f} Mt plan")
closed = pore * P['ct'] * P['dp'] * P['rho'] / 1e9
lab = f"{P['dp'] / 1e6:.1f} MPa" if SI else f"{P['dp'] / 6894.8:,.0f} psi"
print(f"Closed-volume limit (pressure rise {lab}, total compressibility {P['ct']:.1e} 1/Pa): {closed:.0f} Mt")

# injectivity: steady radial flow of CO2 with endpoint relative permeability, drawdown budget at the wellbore
k = P['k'] * 9.869e-16
def rate(dp_well, re=1000.0, rw=0.1, skin=2.0):
    qv = 2 * math.pi * k * P['krc'] * P['h'] * dp_well / (P['mu_c'] * (math.log(re / rw) + skin))
    return qv * P['rho'] * 3.156e7 / 1e9          # Mt/yr
print("\nInjectivity per well (Mt/yr) for near-well pressure budgets:")
for dpw in (1e6, 2e6, 3e6):
    lab = f"{dpw / 1e6:.0f} MPa" if SI else f"{dpw / 6894.8:,.0f} psi"
    print(f"  {lab:>8s}: reservoir allows {rate(dpw):.2f} Mt/yr; tubing and wellhead limit {P['tubing']:.1f} Mt/yr")
per = min(rate(2e6), P['tubing'])
n = math.ceil(3.0 / per)
print(f"Wells for 3.0 Mt/yr at {per:.2f} Mt/yr each: {n}, plus one spare for workovers = {n + 1}")Area 232 mi2, net 150 ft, porosity 0.26: pore volume 44.8 billion bbl CO2 density at reservoir conditions 573 kg/m3 (35.8 lb/ft3) DOE efficiency factors for clastic saline formations (formation scale): P10: E = 0.51% capacity 21 Mt short of the 75 Mt plan P50: E = 2.00% capacity 82 Mt covers the 75 Mt plan P90: E = 5.50% capacity 225 Mt covers the 75 Mt plan Closed-volume limit (pressure rise 1,146 psi, total compressibility 1.2e-09 1/Pa): 39 Mt Injectivity per well (Mt/yr) for near-well pressure budgets: 145 psi: reservoir allows 0.96 Mt/yr; tubing and wellhead limit 1.0 Mt/yr 290 psi: reservoir allows 1.92 Mt/yr; tubing and wellhead limit 1.0 Mt/yr 435 psi: reservoir allows 2.88 Mt/yr; tubing and wellhead limit 1.0 Mt/yr Wells for 3.0 Mt/yr at 1.00 Mt/yr each: 3, plus one spare for workovers = 4
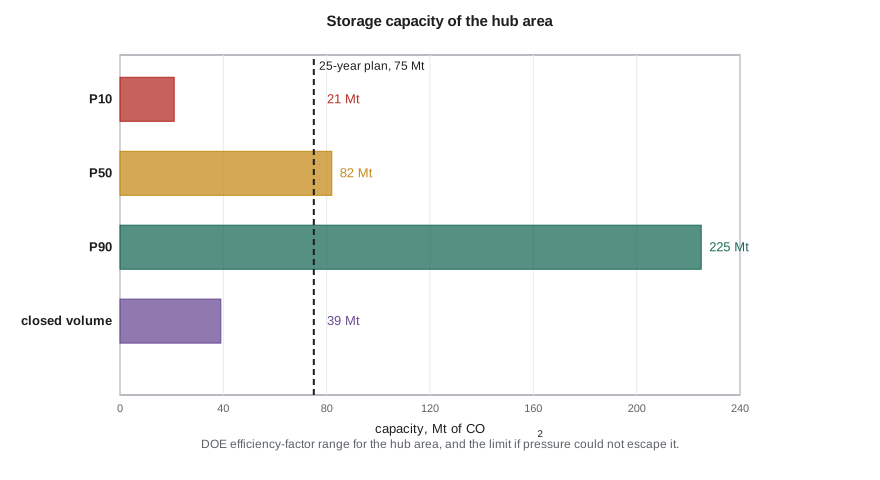
The 232 square mile (600 km²) hub area, with 150 ft of net sand at 26 percent porosity, has about 45 billion barrels (7.1 billion m³) of pore volume. At the P50 efficiency, it holds about 82 million metric tons, just above the plan; at P10 it holds only 21 million, and at P90 about 225 million. Ethan's conclusion was that the area was probably adequate but not certainly, and that the test well and injection test should be planned to narrow the range before any commitment. He also noted that the efficiency factor already includes buoyancy and sweep; using a site simulation instead would give a more defensible number for the permit.
Pressure-limited capacity
The efficiency method assumes the formation is open: the brine displaced by CO₂ moves away, and pressure dissipates into the wider aquifer. If the storage area is closed, by sealing faults, pinch-outs or neighboring projects that raise pressure too, the CO₂ can fit only by compressing the brine and the rock. The capacity is then the injected volume that raises the average pressure to the allowed limit:
With a total compressibility c_t of about 1.2 × 10⁻⁹ Pa⁻¹ and an allowed rise of 7.9 MPa (1,146 psi), the closed-volume capacity is 39 million metric tons, short of the plan. In practice the Frio extends far beyond the hub area, so it is not closed, but neighboring hubs injecting into the same formation would share its pressure capacity. Several Class VI applications in the same Gulf Coast formations have raised the same issue, and pressure interaction between projects is part of each area of review. Lesson 9 calculates the pressure in time and space; the lesson here is that pressure, not pore volume, often limits storage.
Worked problem
Capacity of a test area
A storage area of 77 square miles (200 km²) has a net thickness of 98 ft (30 m) and porosity 0.20. CO₂ density at reservoir conditions is 42.5 lb/ft³ (680 kg/m³). Estimate the P50 capacity with E = 2.0 percent, and the closed-volume capacity for an allowed pressure rise of 1,450 psi and c_t = 1.0 × 10⁻⁹ Pa⁻¹.
Show solution
- Pore volume = 200 × 10⁶ m² × 30 m × 0.20 = 1.20 × 10⁹ m³.
- P50 capacity = 1.20 × 10⁹ × 680 × 0.020 = 1.63 × 10¹⁰ kg = 16.3 Mt.
- Closed capacity = 1.20 × 10⁹ × 1.0 × 10⁻⁹ × 10 × 10⁶ Pa × 680 kg/m³ = 8.2 × 10⁹ kg = 8.2 Mt.
Answer: About 16 Mt at P50 in an open system, but only about 8 Mt if the area were closed. Knowing the boundaries matters as much as knowing the porosity.
Injectivity
Injectivity is the rate a well can inject for a given pressure above the formation pressure. For steady radial flow of CO₂ near the well, Darcy's law gives:
Because CO₂ is about ten times less viscous than brine, its mobility near the well is high even with a reduced relative permeability, so injectivity is usually better than a water injection test suggests. The pressure budget at the well is shared between the near-well flow of CO₂, the pressure buildup in the brine beyond the plume and interference from other wells (Lesson 9). With 300 mD rock and 150 ft of sand, the code shows that a 290 psi near-well drawdown would allow well over a million metric tons a year per well. In practice, the tubing, wellhead equipment and the wish to spread CO₂ over a larger area limited the design rate to 1.0 million metric tons a year per well, so the hub needs three injectors plus one spare for workovers. Gulf Coast storage projects have generally planned for similar rates per well in the Frio and Miocene sands.
Dynamic capacity: rate and time together
Static estimates say how much CO₂ fits; they do not say how fast it can go in. Dynamic capacity combines the two: the total that can be injected over the project life at the planned rate without exceeding the pressure limit anywhere, given the wells, their spacing and the formation's boundaries. It is always less than or equal to the static estimate, and it depends on decisions the engineers control. Spreading wells over a larger area lowers the pressure interference between them; injecting at a steady rate rather than in surges keeps buildup down; and extracting brine from the formation, discussed in Lesson 9, can create room where pressure is the constraint. For the hub, Ethan proposed four well locations on a line about 2.5 miles apart along the strike of the formation, so that their pressure fronts would overlap only after several years, and a fifth location reserved for a future brine producer. The simulation model would test that layout against the full range of capacity and permeability from the test well before the permit application.
Thermal and geochemical effects at the well
Two effects can change injectivity with time. Cold injection cools the rock around the well, reducing the stress there and potentially opening thermal fractures; this can increase injectivity, but fractures that grow into the seal must be avoided, so the design checks the cooled zone's stresses. And dry CO₂ evaporates brine near the well, which in very saline formations can precipitate salt in the pores and reduce permeability, a problem seen in some projects; periodic fresh water injection can redissolve it. Conversely, carbonic acid can dissolve carbonate cement near the well and improve injectivity. Well testing during operations, with falloff tests and continuous pressure monitoring, tracks these changes.
Well design for CO₂
Injection wells for CO₂ are designed for a corrosive fluid if water is ever present. Tubing is often 13 percent chromium steel or carbon steel with a corrosion-resistant lining, the packer and wellhead use CO₂-compatible elastomers, which can blister when dense CO₂ decompresses, and the cement across the seal is a CO₂-resistant blend or a conventional cement placed with great care, since a good bond across the caprock is the main defense against leakage along the well. The annulus is filled with inhibited fluid and its pressure is monitored continuously; a rising annulus pressure is the first sign of a tubing or packer leak. EPA's Class VI rules specify construction, testing and monitoring for CO₂ injection wells, including corrosion-resistant materials and continuous annulus monitoring.
The wellhead pressure of a CO₂ injector is lower than for a gas injector at the same bottomhole pressure, because the dense column in the tubing weighs nearly as much as a water column. At 6,000 ft, a column of CO₂ at about 50 lb/ft³ adds about 2,100 psi of head, so a bottomhole pressure of 2,900 psia needs a wellhead pressure of only about 900 to 1,100 psia, after friction. That is close to the vapor pressure, and if the wellhead pressure falls further, for example at low rates, the CO₂ can flash in the upper tubing with strong cooling. Operators therefore keep a minimum wellhead pressure, with a choke or by managing rate across wells, and design the tubing size for the full range of expected rates.
Common mistakes
MistakeQuoting a single capacity number.
InsteadReport a range (P10, P50, P90 or low, best, high) and the method used.
MistakeUsing pore volume capacity when the area may be closed.
InsteadCheck pressure-limited capacity; boundaries and neighboring projects can make pressure the limit.
MistakeEstimating CO₂ injectivity from water injection without mobility correction.
InsteadUse CO₂ viscosity and relative permeability; CO₂ injectivity is usually higher.
MistakeIgnoring low wellhead pressure in injector design.
InsteadKeep the wellhead above the vapor pressure to avoid flashing and cooling; size tubing for the rate range.
Summary and key terms
- Storage capacity is classified like resources and reserves, from theoretical to matched, and booked under the SRMS.
- The DOE method multiplies pore volume, CO₂ density and an efficiency factor of about 0.5 to 5.5 percent for clastics.
- In closed or shared formations, pressure limits capacity: G ≈ V_p c_t Δp_max ρ.
- Injectivity follows radial Darcy flow with CO₂ mobility; low CO₂ viscosity helps.
- Thermal fracturing, salt precipitation and dissolution can change injectivity over time.
- CO₂ injectors use corrosion-resistant materials, careful cement across the seal and annulus monitoring.
- Storage efficiency factor
- The fraction of the bulk pore volume expected to be filled with CO₂.
- SRMS
- The SPE Storage Resources Management System for classifying storage capacity.
- Pressure-limited capacity
- The CO₂ that can be stored before average pressure reaches its allowed limit.
- Injectivity
- The injection rate per unit of pressure difference at the well.
- Salt precipitation
- Deposition of salt in pores near the well as dry CO₂ evaporates brine.
- Annulus pressure monitoring
- Continuous measurement of the pressure between tubing and casing to detect leaks.
Practice problems
Work each problem on paper first, then reveal the answer to check.
A formation has a pore volume of 2 × 10⁹ m³ and CO₂ density 700 kg/m³. What is its P50 capacity at E = 2 percent?
Show answer
2 × 10⁹ × 700 × 0.02 = 2.8 × 10¹⁰ kg = 28 Mt.
Why can a highly permeable but small, fault-bounded formation be a poor storage site?
Show answer
Its pressure-limited capacity is small, even if injectivity is high.
Why is CO₂ injectivity usually higher than water injectivity in the same well?
Show answer
CO₂ viscosity is about a tenth of brine's, which outweighs its lower relative permeability.
What does a steadily rising annulus pressure in an injector suggest?
Show answer
A leak in the tubing, packer or wellhead into the annulus.
Lesson quiz · 5 questions
Score 60% or more to complete this lesson.
Create a free account to save your progress, take quizzes and earn a certificate.