
PET-460 · Lesson 1 of 12 · 23 min
CCS and the carbon budget
Three years after the Prairie Crest gas project came on stream, Lena Haugen, now vice-president of development, called Ethan Cardinal and Farid Mansour into her office with a map of the Texas Gulf Coast. Four industrial plants within 25 miles of each other had approached Prairie Crest with the same question: if they captured their carbon dioxide, could someone take it away and store it permanently? Prairie Crest had the subsurface skills, a pipeline team and a history in the formation the plants sat above. “We are going to look at becoming a transport and storage operator,” Lena said. “The Matagorda Bend storage hub. I want to know whether the rocks can take it, what it costs, and whether anyone will pay for it. Start with what the emitters actually mean by capture.”
This course follows that study. It covers the whole chain of carbon capture and storage (CCS): how CO₂ is separated from industrial gas streams, how it behaves as a fluid, how it is compressed and moved by pipeline, how a storage site is chosen and characterized, how CO₂ is trapped underground, how much a formation can hold and how fast wells can inject, how the plume and the pressure spread, how a site is monitored, and how regulation, liability and credits shape a project. The last lesson brings it together as a hub development plan. Much of it rests on petroleum engineering you already know: phase behavior, Darcy flow, well testing, material balance and economics. The difference is that the fluid goes down instead of up, and the project is judged by what stays underground for centuries.
Why capture and store carbon
Burning fossil fuels and making cement and chemicals release about 37 billion metric tons of CO₂ a year worldwide. Holding warming to the levels in the Paris Agreement requires net emissions to fall toward zero by around mid-century, and the cumulative amount that can still be emitted for a given level of warming, the remaining carbon budget, is small compared with current annual emissions. Most reductions will come from efficiency, electrification and low-carbon electricity. CCS earns its place in the parts of the economy where those options are poor: process emissions from cement, where CO₂ comes from the limestone itself, not from fuel; hydrogen and ammonia made from natural gas; natural gas processing, where CO₂ must be removed anyway to meet pipeline specifications; and some high-temperature industrial heat. Combined with bioenergy or direct air capture, storage can also remove CO₂ that is already in the atmosphere.
Scenarios from the International Energy Agency and the Intergovernmental Panel on Climate Change that reach net zero rely on capturing on the order of a billion metric tons a year by 2030 and several billion by 2050. Operating capture capacity in the mid-2020s was only about 50 million metric tons a year, a few hundredths of a percent of global emissions, though a long list of projects was under development. The gap between ambition and practice is the reason the economics and regulation lessons of this course matter as much as the engineering ones.
A short history
Injecting CO₂ underground is not new. Since the 1970s, CO₂ from natural sources and gas plants has been injected into oil reservoirs in west Texas to improve recovery, and the PET-430 course covered that process. Dedicated storage for climate reasons began in 1996, when Equinor's Sleipner project in the North Sea started separating CO₂ from natural gas and injecting about a million metric tons a year into the Utsira sandstone, partly to avoid Norway's offshore carbon tax. Sleipner's repeated seismic surveys became the textbook demonstration that a CO₂ plume can be tracked. Canada contributed two landmark projects: Weyburn-Midale in Saskatchewan, where CO₂ piped from a North Dakota gasification plant has been used for enhanced recovery and studied as storage since 2000, and Boundary Dam Unit 3 near Estevan, which in 2014 became the first coal power unit with full-scale post-combustion capture. SaskPower reports that the unit had captured about 7.3 million metric tons by the end of 2025, roughly 0.72 million metric tons in 2025 alone.
In the Texas Gulf Coast, Shell's Quest project has captured about a million metric tons a year from the Scotford upgrader's hydrogen plants since late 2015 and injected it into the Frio Formation at about 2 km depth. The Alberta Carbon Trunk Line, about 240 km long and sized for up to 14.6 million metric tons a year, has since 2020 carried CO₂ from a refinery and a fertilizer plant to the Clive oil field for enhanced recovery. In the United States, the Illinois Basin–Decatur project stored CO₂ from an ethanol plant in the Mount Simon sandstone, and the US Gulf Coast hosts a growing list of permitted and proposed storage hubs. These projects supply most of the field data this course uses.
The CCS chain
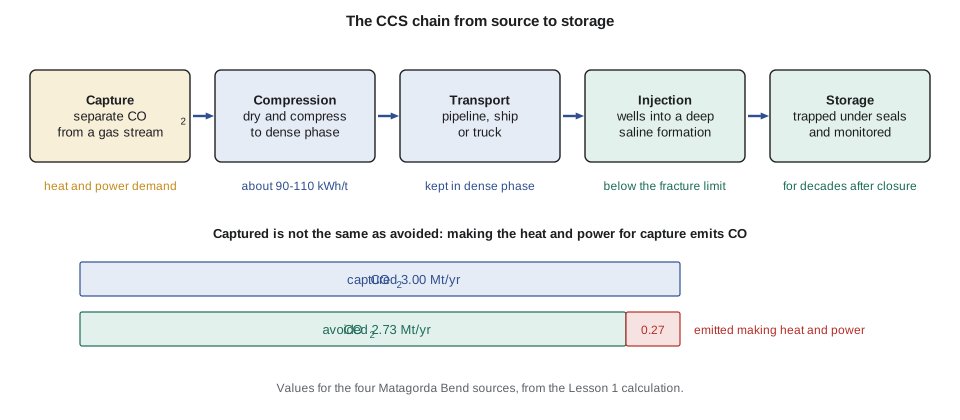
Every CCS project has the same links. Capture separates CO₂ from a gas stream, usually with a solvent that absorbs CO₂ and releases it when heated. Conditioning removes water and impurities and compresses the CO₂ to a dense, liquid-like state. Transport moves it, almost always by pipeline on land, sometimes by ship or truck for small or remote sources. Injection puts it into a deep porous formation through wells. Storage keeps it there, trapped beneath impermeable seals, and monitoring demonstrates that it stays. A failure anywhere breaks the chain: a capture plant that trips sends CO₂ to the atmosphere, a pipeline outage idles every source, and a storage site that cannot accept the planned rate forces emitters to vent.
That interdependence is the main reason hubs exist. A single emitter that builds its own pipeline and storage site carries the whole chain's risk and cost. A hub lets several emitters share a trunk line and a storage complex, spreading the large fixed costs of characterization, wells and monitoring over more metric tons, and letting one source's outage be absorbed by the others. Alberta has organized storage tenure around hubs since 2022, awarding evaluation rights to proponents who must offer open access to third parties. On the US Gulf Coast, several developers have proposed hubs to serve the dense cluster of refineries, chemical plants and hydrogen producers.
Captured is not avoided
The first number Ethan checked was the difference between CO₂ captured and CO₂ avoided. Capture needs energy: heat to regenerate the solvent, electricity for fans, pumps and compressors. If that energy comes from burning natural gas or from a grid that burns fossil fuels, it emits CO₂ of its own, and some of that is not captured. The CO₂ avoided is the reduction in emissions compared with the same plant without capture:
Here E₀ is the plant's emissions without capture, E_CCS its emissions with capture, C the CO₂ captured and X the extra emissions caused by supplying the capture energy that are not themselves captured. A high-purity source, such as the vent of a fertilizer plant where CO₂ is already separated as part of making ammonia, needs only drying and compression, and almost every metric ton captured is a metric ton avoided. A dilute flue gas needs a large solvent plant and a lot of steam, and the gap widens. Cost comparisons should therefore use cost per metric ton avoided, which is always higher than cost per metric ton captured.
# CO2 captured versus CO2 avoided for the four hub sources.
# Capture needs heat (solvent regeneration) and power (fans, pumps, compression); supplying them emits CO2 too.
SI = False     # True: Canadian hub (Alberta grid), False: US hub (Texas grid)

# name, CO2 captured Mt/yr, capture fraction of the treated stream, regeneration heat GJ/t, power kWh/t (capture + compression)
if SI:
    hub = [("Hydrogen plant (SMR, process gas)", 1.20, 0.90, 1.0, 110), ("Fertilizer plant (high purity)", 0.80, 0.98, 0.0, 95),
           ("Cement plant (kiln flue gas)", 0.60, 0.90, 3.2, 150), ("Cogeneration (turbine flue gas)", 0.40, 0.90, 3.6, 165)]
    grid = 0.48           # t CO2 per MWh, illustrative Alberta grid average
else:
    hub = [("Hydrogen plant (SMR, process gas)", 1.20, 0.90, 1.0, 110), ("Ammonia plant (high purity)", 0.90, 0.98, 0.0, 95),
           ("Gas processing (amine vent)", 0.50, 0.99, 0.0, 90), ("Refinery heaters (flue gas)", 0.40, 0.90, 3.4, 160)]
    grid = 0.37           # t CO2 per MWh, illustrative Texas grid average
GAS_EF, BOILER_EFF = 0.0503, 0.88    # t CO2 per GJ of natural gas burned (HHV basis); boiler efficiency

print(f"{'source':36s}{'captured':>9s}{'heat':>8s}{'power':>8s}{'extra':>8s}{'avoided':>9s}{'ratio':>7s}")
print(f"{'':36s}{'Mt/yr':>9s}{'PJ/yr':>8s}{'GWh/yr':>8s}{'Mt/yr':>8s}{'Mt/yr':>9s}{'':>7s}")
tc = ta = 0.0
for name, cap, f, q, kwh in hub:
    heat = cap * q                                 # PJ/yr, since Mt x GJ/t = PJ
    power = cap * kwh                              # GWh/yr, since Mt x kWh/t = GWh
    extra = heat / BOILER_EFF * GAS_EF + power * grid / 1000   # Mt/yr from making that heat and power
    # the extra emissions from the heat boiler are not captured; avoided = captured - extra
    avoided = cap - extra
    tc += cap; ta += avoided
    print(f"{name:36s}{cap:9.2f}{heat:8.2f}{power:8.0f}{extra:8.3f}{avoided:9.2f}{avoided / cap:7.0%}")
print(f"{'Hub total':36s}{tc:9.2f}{'':24s}{ta:9.2f}{ta / tc:7.0%}")
cost_capture = 72.0 if SI else 55.0      # illustrative levelized cost per metric ton captured, local currency
print(f"\nAt {cost_capture:.0f} per metric ton captured, the cost per metric ton avoided is {cost_capture * tc / ta:.0f}.")
print(f"Twenty-five years at this rate stores {tc * 25:.0f} Mt; global fossil emissions are about 37,000 Mt per year.")source captured heat power extra avoided ratio
Mt/yr PJ/yr GWh/yr Mt/yr Mt/yr
Hydrogen plant (SMR, process gas) 1.20 1.20 132 0.117 1.08 90%
Ammonia plant (high purity) 0.90 0.00 86 0.032 0.87 96%
Gas processing (amine vent) 0.50 0.00 45 0.017 0.48 97%
Refinery heaters (flue gas) 0.40 1.36 64 0.101 0.30 75%
Hub total 3.00 2.73 91%
At 55 per metric ton captured, the cost per metric ton avoided is 60.
Twenty-five years at this rate stores 75 Mt; global fossil emissions are about 37,000 Mt per year.For the Matagorda Bend storage hub, the four sources capture 3.00 million metric tons a year and avoid about 2.73 million. The high-purity ammonia stream avoids 95 percent of what it captures; the flue gas from the refinery heaters only about 72 to 75 percent, because it needs about 3.5 GJ of heat per metric ton. Ethan noted two consequences. First, any regulation or credit that pays per metric ton captured, rather than per metric ton avoided, rewards dilute sources more than their climate value justifies, so the hub's contracts must count carefully. Second, the hub should take the high-purity streams first: they are cheap to capture, avoid nearly all their CO₂ and give the storage site its first volumes while the larger solvent plants are being built.
Worked problem
Cost per metric ton avoided
A capture plant on a gas-fired boiler captures 400,000 metric tons of CO₂ a year at a levelized cost of 55 US dollars per metric ton captured. Its regeneration steam comes from a new gas boiler that emits 60,000 t a year, and its electricity adds 20,000 t a year of grid emissions. Find the CO₂ avoided and the cost per metric ton avoided.
Show solution
- Extra emissions X = 60,000 + 20,000 = 80,000 t/yr.
- Avoided = C − X = 400,000 − 80,000 = 320,000 t/yr.
- Annual cost = 400,000 × 55 = 22.0 million.
- Cost per metric ton avoided = 22.0 million / 320,000 = 68.75 per metric ton.
Answer: The plant avoids 80 percent of what it captures, and each metric ton avoided costs 25 percent more than each metric ton captured. Capturing the boiler's own CO₂ as well would raise the ratio but add capture cost.
Where the CO₂ comes from
Industrial CO₂ streams differ in concentration, pressure, impurities and size, and those properties decide the capture method and its cost. The table compares the hub's sources with other common streams.
| Source | CO₂ in the stream | Pressure | Typical capture route | Notes |
|---|---|---|---|---|
| Natural gas processing | 2–10% in raw gas; vent near 100% | high (raw gas) | already separated by amine | cheapest; needs only compression |
| Ammonia and fertilizer | near 100% (process vent) | low | already separated | cheap; one of the first sources in most hubs |
| Hydrogen by steam reforming | 15–20% in shifted syngas | 2–3 MPa | amine or physical solvent on syngas | flue gas from the reformer furnace is dilute |
| Cement kiln | 15–30% in flue gas | atmospheric | amine or oxy-fuel | about 60% is process CO₂ from limestone |
| Coal power or heaters | 10–15% | atmospheric | amine | SO₂ and dust must be removed first |
| Gas turbine | 3–5% | atmospheric | amine | large gas volume per metric ton |
| Ambient air | 0.042% | atmospheric | direct air capture | highest energy per metric ton |
The Brazosport hydrogen plant reforms natural gas and already has a shift reactor and a syngas stream with about 17 percent CO₂ at about 360 psia; capture there is a pre-combustion process covered in Lesson 3. The Tidewater ammonia plant vents nearly pure CO₂. The Sargent gas plant produces a high-purity CO₂ stream from its amine units, which today is simply vented, and the Brazos Bend refinery heaters emit dilute flue gas that needs a post-combustion amine plant, the subject of Lesson 2. Sofia Reyes, the facilities lead, pointed out that the four streams would also arrive with different impurities: oxygen and nitrogen from flue gas plants, hydrogen and methane from the syngas plant, and water from all of them. Setting a single pipeline specification is one of the hub's early jobs.
Measuring success: permanence and scale
Storage is judged by two numbers that petroleum projects rarely consider. The first is permanence. The IPCC concluded in its 2005 special report that well-selected and well-managed geological storage is likely to retain more than 99 percent of the injected CO₂ over 1,000 years. That claim rests on site selection, on trapping mechanisms that strengthen with time (Lesson 7) and on monitoring that would detect and allow correction of a problem. The second is scale. A single hub storing 3 million metric tons a year for 25 years, 75 million metric tons, would be among the larger projects in the world today, yet it is about two thousandths of one year of global emissions. Reaching gigaton scale means hundreds of such hubs, and the bottleneck is likely to be characterized, permitted storage rather than capture technology.
There is also the question of what CCS should not be used for. Capture on a plant whose output could be supplied without fossil fuels at similar cost may delay better solutions. Using captured CO₂ for enhanced oil recovery stores CO₂ but also produces oil; Lesson 11 shows how policies treat it. Ethan's study would have to answer those questions for each source, not just the engineering ones.
The Matagorda Bend study
Lena's brief set out the work, and the lessons that follow match its parts: what each source's capture involves and costs (Lessons 2 and 3); how the CO₂ behaves and how to transport it (Lessons 4 and 5); whether the Frio Formation at about 6,000 ft can store 75 million metric tons safely (Lessons 6 to 9); how to prove it (Lesson 10); what the rules and credits are (Lesson 11); and whether the business works (Lesson 12). Farid would lead the subsurface work with Ethan, Sofia the pipeline and compression, Gwen Halvorsen, the contract process engineer from the gas project, the capture plants, and Mei Lin the laboratory program on core, brine and seal samples. A new geophysicist, Amara Okafor, joined to plan the monitoring.
Common mistakes
MistakeQuoting metric tons captured as the climate benefit of a project.
InsteadReport metric tons avoided, after the emissions from the energy used for capture and compression.
MistakeTreating CCS as a replacement for efficiency or electrification everywhere.
InsteadApply it where alternatives are poor: process emissions, gas processing, hydrogen and ammonia, and carbon removal.
MistakePlanning capture before storage is proven.
InsteadStart storage appraisal early; it is usually the longest and most uncertain part of the chain.
MistakeAssuming every source can use the same pipeline specification without treatment.
InsteadList each stream's impurities and agree on a hub specification before designing any part of the chain.
Summary and key terms
- CCS captures CO₂ from industrial streams, compresses and transports it, and injects it into deep formations for permanent storage.
- It is most valuable for process emissions, gas processing, hydrogen and ammonia, and for carbon removal with bioenergy or air capture.
- Operating capture capacity in the mid-2020s was about 50 million metric tons a year, far below net-zero pathways.
- CO₂ avoided equals CO₂ captured minus the uncaptured emissions from the energy used for capture; cost per metric ton avoided is the fair comparison.
- High-purity sources are cheapest and should anchor a hub; dilute flue gases need large solvent plants.
- Hubs share transport and storage costs and risks among several emitters.
- CCS
- Carbon capture and storage: separating CO₂ from a gas stream and storing it permanently underground.
- CO₂ avoided
- The reduction in emissions compared with the same plant without capture, net of the emissions caused by capture.
- Carbon budget
- The cumulative CO₂ that can still be emitted for a given probability of limiting warming to a given level.
- Hub
- A shared transport and storage system serving several emitters.
- Process emissions
- CO₂ released by a chemical process rather than by burning fuel, such as limestone calcination in cement making.
- Permanence
- The fraction of injected CO₂ expected to remain stored over a stated period.
Practice problems
Work each problem on paper first, then reveal the answer to check.
A source captures 1.0 Mt/yr and its capture energy causes 0.15 Mt/yr of uncaptured emissions. What is the avoided fraction?
Show answer
Avoided = 1.0 − 0.15 = 0.85 Mt/yr, 85 percent of the captured CO₂.
Why is a fertilizer plant's CO₂ vent a cheap source?
Show answer
The CO₂ is already separated at nearly 100 percent purity as part of the process; it needs only drying and compression.
Roughly how much of global annual emissions does a 3 Mt/yr hub capture?
Show answer
3 / 37,000 ≈ 0.008 percent per year; hundreds of hubs are needed for gigaton scale.
Name two reasons several emitters share a hub rather than each building its own storage.
Show answer
Shared fixed costs of pipelines, wells and monitoring; and resilience, since one source's outage does not idle the storage system.
Lesson quiz · 5 questions
Score 60% or more to complete this lesson.
Create a free account to save your progress, take quizzes and earn a certificate.