
PET-460 · Lesson 4 of 12 · 21 min
CO2 properties and phase behavior
Mei Lin's first request from Farid was not a core analysis but a table: the density, viscosity and phase of CO₂ at every point from the compressor discharge to the bottom of the injection wells. “Every calculation in this study needs one of those three numbers,” Farid said, “and CO₂ is not a gas you can treat with a z-factor chart and forget. Near its critical point a few degrees changes its density by half.” Ethan had used CO₂ properties in the enhanced recovery course, but only at reservoir conditions. A storage hub handles it across the whole range, from the vapor leaving a capture plant to the dense fluid in the formation.
The phase diagram
CO₂ has a triple point at −56.6 °C and 518 kPa, below which it cannot exist as a liquid; at atmospheric pressure solid CO₂ (dry ice) sublimes directly to gas at −78.5 °C. Its critical point is at 31.0 °C and 7.38 MPa. Above both the critical temperature and the critical pressure it is a supercritical fluid, with a density close to a liquid's and a viscosity close to a gas's. Between the triple point and the critical point, the vapor pressure curve separates liquid from gas. The critical temperature is close to ordinary ground temperatures, which is what makes CO₂ awkward: a pipeline at 1,740 psia holds liquid in winter and a supercritical fluid in a hot summer, and a well that warms on the way down can cross from one to the other without any phase boundary at all.
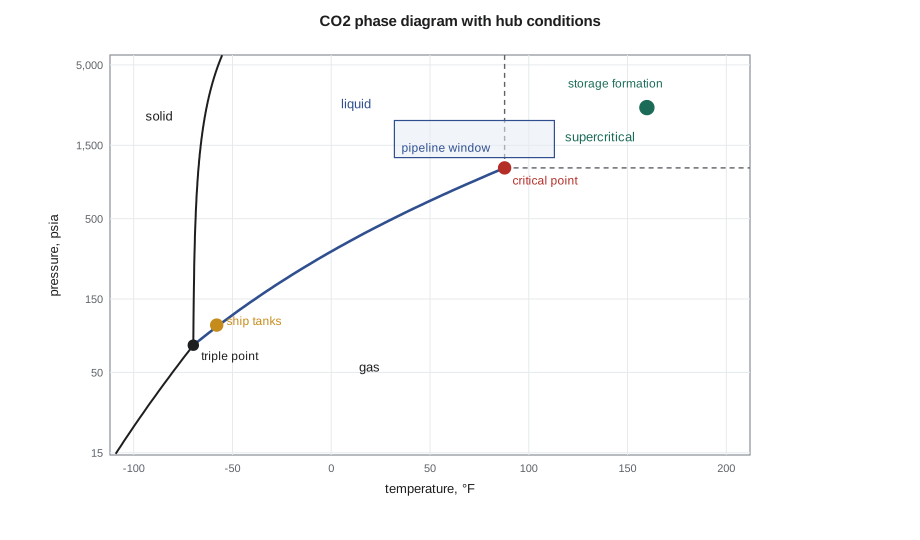
For transport, the useful states are the dense phase, either liquid or supercritical above about 1,230 psia, where CO₂ has a density of 600 to 62 lb/ft³ and can be pumped like a liquid, and the cold low-pressure liquid used for ships, at about −50 °C and 100 psia near the triple point, or −30 °C and 220 to 290 psia for medium-pressure ships. Gas-phase pipelines, below about 700 psia, are used for short collection lines from capture plants but carry little mass per unit of pipe. The worst place to operate is near the vapor pressure curve, where a small pressure or temperature change can flash liquid to vapor and cause two-phase flow, slugging and erratic pump behavior.
Density
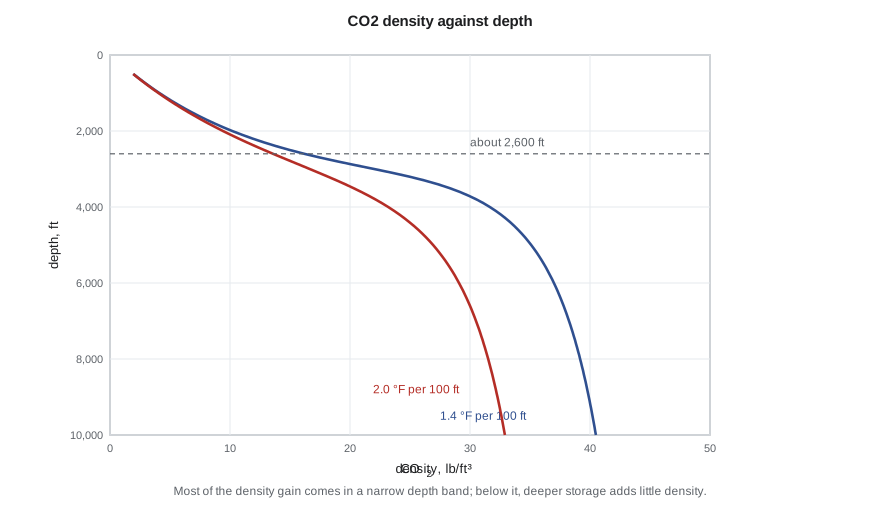
CO₂ density is the property that decides how much fits in a pipe and in a pore. At standard conditions it is about 0.117 lb/ft³, 1.5 times as dense as air, which is why a large release flows downhill and collects in low ground. In the dense phase its density ranges from about 37 to 69 lb/ft³, and it is highly compressible near the critical point. No simple correlation covers that range. The reference equation of state for CO₂, by Span and Wagner (1996), is accurate to a few hundredths of a percent and is the basis of property software. Cubic equations such as Peng-Robinson, familiar from the PVT course, are convenient and usually within about 5 percent of the reference density away from the critical point, reading low for dense CO₂; volume translation reduces the error.
# CO2 density and phase from the Peng-Robinson equation of state (stdlib only).
# Peng-Robinson is within about 5 percent of the reference (Span-Wagner) density away from the critical point; it reads low for dense CO2.
import math
SI = False     # True: metric units (Canadian hub), False: oilfield units (US hub)

R = 8.314462; TC, PC, W, MW = 304.13, 7.3773e6, 0.22394, 0.0440095   # K, Pa, acentric factor, kg/mol

def cubic_roots(a2, a1, a0):
    # real roots of z^3 + a2 z^2 + a1 z + a0 = 0
    q = (3 * a1 - a2 * a2) / 9; r = (9 * a2 * a1 - 27 * a0 - 2 * a2 ** 3) / 54; d = q ** 3 + r * r
    if d > 0:
        s = math.copysign(abs(r + math.sqrt(d)) ** (1 / 3), r + math.sqrt(d))
        t = math.copysign(abs(r - math.sqrt(d)) ** (1 / 3), r - math.sqrt(d))
        return [s + t - a2 / 3]
    th = math.acos(r / math.sqrt(-q ** 3))
    return sorted(2 * math.sqrt(-q) * math.cos((th + 2 * math.pi * k) / 3) - a2 / 3 for k in range(3))

def pr(T, p):
    """Return density kg/m3, compressibility factor z and a phase label for CO2 at T (K) and p (Pa)."""
    k = 0.37464 + 1.54226 * W - 0.26992 * W * W
    a = 0.45724 * R * R * TC * TC / PC * (1 + k * (1 - math.sqrt(T / TC))) ** 2
    b = 0.07780 * R * TC / PC
    A, B = a * p / (R * T) ** 2, b * p / (R * T)
    zs = [z for z in cubic_roots(-(1 - B), A - 3 * B * B - 2 * B, -(A * B - B * B - B ** 3)) if z > B]
    def lnphi(z):
        return z - 1 - math.log(z - B) - A / (2 * math.sqrt(2) * B) * math.log((z + 2.414214 * B) / (z - 0.414214 * B))
    z = min(zs, key=lnphi)                        # stable root: lowest fugacity
    if T > TC and p > PC: ph = 'supercritical'
    elif T > TC: ph = 'gas (above Tc)'
    else: ph = 'liquid' if z == min(zs) and len(zs) > 1 or (len(zs) == 1 and z < 0.3) else 'gas'
    return p * MW / (z * R * T), z, ph

if SI:
    print("Hub conditions (Peng-Robinson, CO2)")
    cases = [("compressor discharge", 45.0, 15000), ("pipeline, winter ground", 4.0, 12000), ("pipeline, summer ground", 15.0, 10000),
             ("wellhead, injecting", 20.0, 9000), ("reservoir, Basal Cambrian", 60.0, 20500)]
    print(f"{'location':28s}{'T, C':>7s}{'p, kPa':>9s}{'rho, kg/m3':>12s}{'z':>7s}  phase")
    for name, t, p in cases:
        rho, z, ph = pr(t + 273.15, p * 1000); print(f"{name:28s}{t:7.0f}{p:9,.0f}{rho:12.0f}{z:7.3f}  {ph}")
    print("\nDensity with depth, 10 kPa/m hydrostatic, 8 C surface, two geothermal gradients")
    print(" depth m   rho at 25 C/km   rho at 35 C/km")
    for d in range(500, 3001, 250):
        p = 101.3e3 + 10.0e3 * d
        r1 = pr(281.15 + 0.025 * d, p)[0]; r2 = pr(281.15 + 0.035 * d, p)[0]
        print(f"{d:8,d}{r1:15.0f}{r2:17.0f}")
else:
    print("Hub conditions (Peng-Robinson, CO2)")
    cases = [("compressor discharge", 113.0, 2175), ("pipeline, winter ground", 50.0, 1740), ("pipeline, summer ground", 80.0, 1450),
             ("wellhead, injecting", 85.0, 1300), ("reservoir, Frio", 160.0, 2640)]
    print(f"{'location':28s}{'T, F':>7s}{'p, psia':>9s}{'rho, lb/ft3':>13s}{'z':>7s}  phase")
    for name, t, p in cases:
        rho, z, ph = pr((t - 32) / 1.8 + 273.15, p * 6894.757); print(f"{name:28s}{t:7.0f}{p:9,.0f}{rho / 16.0185:13.1f}{z:7.3f}  {ph}")
    print("\nDensity with depth, 0.433 psi/ft hydrostatic, 70 F surface, two geothermal gradients")
    print(" depth ft   rho at 1.4 F/100 ft   rho at 2.0 F/100 ft   (lb/ft3)")
    for d in range(2000, 10001, 1000):
        p = (14.7 + 0.433 * d) * 6894.757
        r1 = pr((70 + 0.014 * d - 32) / 1.8 + 273.15, p)[0] / 16.0185; r2 = pr((70 + 0.020 * d - 32) / 1.8 + 273.15, p)[0] / 16.0185
        print(f"{d:9,d}{r1:20.1f}{r2:22.1f}")
print("\nMost of the density gain comes between about 600 and 1,000 m (2,000 and 3,500 ft); below that, CO2 density rises only slowly with depth.")Hub conditions (Peng-Robinson, CO2)
location T, F p, psia rho, lb/ft3 z phase
compressor discharge 113 2,175 43.9 0.355 supercritical
pipeline, winter ground 50 1,740 58.6 0.239 liquid
pipeline, summer ground 80 1,450 47.5 0.232 liquid
wellhead, injecting 85 1,300 43.1 0.227 liquid
reservoir, Frio 160 2,640 35.8 0.488 supercritical
Density with depth, 0.433 psi/ft hydrostatic, 70 F surface, two geothermal gradients
depth ft rho at 1.4 F/100 ft rho at 2.0 F/100 ft (lb/ft3)
2,000 10.2 9.4
3,000 22.0 16.6
4,000 31.7 23.2
5,000 35.1 26.9
6,000 37.0 29.1
7,000 38.3 30.5
8,000 39.2 31.5
9,000 39.9 32.3
10,000 40.5 32.9
Most of the density gain comes between about 600 and 1,000 m (2,000 and 3,500 ft); below that, CO2 density rises only slowly with depth.The table shows why storage is planned below about 2,600 ft. In a sedimentary basin with hydrostatic pressure and a normal geothermal gradient, CO₂ density rises steeply with depth through the critical region and then flattens. With a gradient of 1.4 °F per 100 ft, density reaches about 32 lb/ft³ at 4,000 ft and only 39 lb/ft³ at 8,000 ft. In a hotter basin the curve is lower and keeps rising. Above the critical depth, CO₂ is a gas, occupying several times more pore space per metric ton and much more buoyant. Below it, extra depth gains little density but costs drilling, raises temperature and may lower porosity. For the Frio Formation at 6,000 ft, the code gives about 573 kg/m³ (35.8 lb/ft³) at 160 °F and 2,640 psia, and Farid adopted that value for the capacity estimates in Lesson 8, noting that the reference equation would give a few percent more.
Viscosity and buoyancy
Dense CO₂ is much less viscous than brine: about 0.05 to 0.10 mPa·s at storage conditions, against 0.4 to 1.0 mPa·s for formation brine. The mobility ratio of CO₂ to brine is therefore large, about 3 to 5 when the reduced relative permeability of CO₂ is included, and injected CO₂ fingers and overrides rather than displacing brine evenly. It is also lighter than brine. With brine at 1,065 kg/m³ and CO₂ at 573 kg/m³, the density difference of about 490 kg/m³ drives CO₂ upward to the base of the seal, where it spreads laterally as a thin tongue. Buoyancy is the reason storage depends on a caprock, and the combination of low viscosity and buoyancy shapes the plume models of Lesson 9.
Impurities change the phase envelope
Captured CO₂ is never pure. Flue gas capture leaves traces of oxygen, nitrogen and argon; syngas capture leaves hydrogen, carbon monoxide and methane; gas processing CO₂ carries hydrogen sulfide and hydrocarbons; and all streams carry water. Non-condensable impurities such as nitrogen, argon, oxygen and especially hydrogen turn the single vapor pressure curve of pure CO₂ into a two-phase envelope with a bubble point line above it. A few percent of hydrogen can raise the bubble point pressure by several MPa, so the pipeline's minimum operating pressure must rise to keep the stream single-phase. Impurities also lower the density of the dense phase, slightly reducing storage capacity and pipeline throughput, and increase the compression power per metric ton.
Water and certain impurities matter for a different reason: corrosion. Dry CO₂ is not corrosive to carbon steel, but free water dissolves CO₂ to form carbonic acid, which corrodes steel at millimeters per year. Pipeline specifications therefore limit water to a few hundred parts per million or less, well below the solubility of water in dense CO₂, so that no free water can form even if the line cools. Combinations of impurities can react inside the pipe: sulfur dioxide, nitrogen dioxide, oxygen, hydrogen sulfide and water can form sulfuric and nitric acid and elemental sulfur at concentrations each well within its own limit. Recent research has shown that cross-reactions of this kind set tighter limits on mixed streams than tests on single impurities suggested, which is a live issue for hubs that combine flue gas and syngas sources.
| Component | Matagorda Bend specification (illustrative) | Reason |
|---|---|---|
| CO₂ | 95 mol% minimum | density, compression power, storage efficiency |
| Water | 50 ppmv maximum | no free water, so no carbonic acid corrosion or hydrates |
| Oxygen | 10 ppmv maximum | corrosion and acid formation with SO₂, NO₂ and H₂S |
| Hydrogen | 0.75 mol% maximum | raises bubble point pressure; embrittlement concern |
| N₂ + Ar + CH₄ + H₂ (total non-condensables) | 4 mol% maximum | phase envelope and density |
| H₂S | 100 ppmv maximum | toxicity in a release; corrosion |
| SO₂ and NO₂ | 10 ppmv each | acid formation |
| Temperature at delivery | 122 °F maximum | pipeline coating limit |
Sofia drafted that specification after looking at the Brazosport hydrogen plant's hydrogen slip and the Brazos Bend refinery heaters' oxygen. The two streams cannot both arrive at the edge of their limits; the hydrogen plant would add a polishing step, and the flue gas plant would need a catalytic oxygen removal unit. Mei's laboratory would measure each stream's bubble point with the impurities present, rather than trusting an equation of state tuned to pure CO₂.
Worked problem
Bubble point margin for an impure stream
Pure CO₂ at 50 °F has a vapor pressure of about 650 psia. A laboratory test of the blended hub stream with 2 percent non-condensables shows a bubble point of 990 psia at the same temperature. The pipeline's minimum operating pressure is set at the bubble point plus a margin of 220 psi. What minimum pressure applies, and how much higher is it than for pure CO₂?
Show solution
- Minimum pressure = 990 + 220 = 1,210 psia.
- For pure CO₂ it would be 650 + 220 = 870 psia.
- Difference = 340 psi.
Answer: The impurities raise the minimum operating pressure by about 340 psi. The hub sets its minimum at 1,450 psia, which also covers summer temperatures, when the stream is supercritical and density is lower.
Joule-Thomson cooling and hydrates
When dense CO₂ expands across a valve or a leak, it cools sharply, more than natural gas, because of its large Joule-Thomson coefficient near the vapor pressure curve. Depressurizing a pipeline section for maintenance can drop the temperature below −50 °C, embrittling carbon steel that is not rated for it, and forming dry ice at the outlet. Blowdown procedures are therefore slow and staged. The same cooling appears at the top of an injection well when the wellhead pressure is low and the CO₂ flashes in the tubing; Lesson 8 returns to it. With free water present, CO₂ forms hydrates at temperatures up to about 10 °C, another reason water must be removed before transport.
Solubility and brine
CO₂ dissolves in water to about 5 percent by weight at storage conditions, more at lower temperature and higher pressure, and less as salinity rises. Water also dissolves in CO₂ to a small degree, which is why dense CO₂ entering a formation dries the rock near the well and can precipitate salt from very saline brines, reducing injectivity. CO₂-saturated brine is about 1 percent denser than the original brine, a small difference that matters greatly over long times: it sinks, setting up convection that speeds dissolution, as Lesson 7 explains.
Common mistakes
MistakeUsing a gas z-factor correlation for dense CO₂.
InsteadUse the Span-Wagner reference equation, or a cubic equation with volume translation, checked against data.
MistakeDesigning a pipeline at the pure-CO₂ vapor pressure plus a margin.
InsteadBase the minimum operating pressure on the bubble point of the actual impure stream.
MistakeTreating impurities independently when setting limits.
InsteadCheck cross-reactions: SO₂, NO₂, O₂, H₂S and water together can form acids and sulfur at low individual levels.
MistakePlanning storage above the critical depth.
InsteadBelow about 2,600 ft CO₂ is dense; shallower it is a buoyant gas that needs far more pore space.
Summary and key terms
- CO₂ has a critical point at 31.0 °C and 7.38 MPa and a triple point at −56.6 °C and 518 kPa.
- Pipelines operate in the dense phase above about 1,230 psia; ships carry cold low-pressure liquid.
- Density at storage conditions is about 37 to 47 lb/ft³; it rises steeply through the critical region and then flattens with depth.
- CO₂ is less viscous and less dense than brine, so it rises to the seal and spreads as a thin plume.
- Impurities widen the two-phase region, raise the bubble point and can react to form acids; water must be kept below saturation.
- Expansion of dense CO₂ causes strong Joule-Thomson cooling.
- Supercritical fluid
- A substance above both its critical temperature and pressure, with no distinction between liquid and gas.
- Dense phase
- Liquid or supercritical CO₂ with a liquid-like density.
- Span-Wagner equation
- The reference equation of state for pure CO₂.
- Bubble point (impure CO₂)
- The pressure at which a CO₂ mixture with non-condensables first forms vapor.
- Joule-Thomson cooling
- The temperature drop of a fluid expanding at constant enthalpy.
- Critical depth
- The depth below which CO₂ in a basin is in a dense phase.
Practice problems
Work each problem on paper first, then reveal the answer to check.
Is CO₂ at 104 °F and 1,300 psia liquid, gas or supercritical?
Show answer
Supercritical: above both 31.0 °C and 7.38 MPa.
Why is the CO₂-brine density difference important?
Show answer
It drives buoyant flow of CO₂ to the seal and sets the column height a seal can hold.
Name two impurities that raise the bubble point of a CO₂ stream.
Show answer
Hydrogen and nitrogen (also argon, oxygen and methane).
Why is dry CO₂ not corrosive but wet CO₂ is?
Show answer
Free water dissolves CO₂ to form carbonic acid, which attacks carbon steel.
Lesson quiz · 5 questions
Score 60% or more to complete this lesson.
Create a free account to save your progress, take quizzes and earn a certificate.