
PET-340 · Lesson 2 of 12 · 19 min
Inflow performance: productivity index, Vogel and Fetkovich
Before he analyzes the new horizontal well, Marisol gives Ethan a simpler one. The vertical Tamarack 7-15 well in the Mission Canyon pool was acidized last year, and its skin fell from about +5 to about +2. 'It now makes about 384 STB/d,' she says, 'but nobody has asked how much more it could make if we pumped it harder. That question starts with its inflow curve.'
The inflow performance relationship (IPR) describes how much fluid a reservoir delivers to a well for each value of flowing bottomhole pressure. It is the supply side of the production system. This lesson covers the straight-line productivity index for single-phase flow, Vogel's curve for wells producing below the bubble point, the composite curve that joins them, and Fetkovich's backpressure form, with the tests used to build each one.
Drawdown and the productivity index
Fluid flows toward a well because the pressure at the well is lower than the average pressure in its drainage area. The difference between average reservoir pressure and flowing bottomhole pressure is the drawdown. For a single-phase liquid, Darcy's law says that the rate is proportional to the drawdown, and the constant of proportionality is the productivity index J.
PET-320 derived the pseudosteady-state form, which shows what controls J: permeability, net thickness, fluid viscosity and formation volume factor, the size of the drainage area and the skin.
(The constant 141.2 applies in field units; SI versions use a different constant but the same form.) Plotted with pressure on the vertical axis and rate on the horizontal axis, the IPR of a single-phase well is a straight line from the reservoir pressure at zero rate to the absolute open flow (AOF), the theoretical rate at zero bottomhole pressure. No well actually produces at its AOF, but the number is a convenient measure of the well's capacity.
The productivity index is measured with a flow test: the well is produced at a steady rate, the bottomhole pressure is measured with a gauge or calculated from a fluid level or wellhead pressure, and the average reservoir pressure comes from a recent buildup test. J is simply the rate divided by the drawdown. Because J depends on skin, it is also the quickest way to tell whether a stimulation worked. The Tamarack 7-15 well's J roughly doubled after its acid job.
Below the bubble point: Vogel's curve
When the bottomhole pressure falls below the bubble point, gas comes out of solution near the well. The gas occupies pore space, reduces the relative permeability to oil and increases the oil viscosity. Each extra unit of drawdown therefore brings less oil than the one before, and the IPR curves toward the pressure axis.
In 1968 Vogel ran computer simulations of many solution-gas-drive reservoirs and found that, plotted in dimensionless form, their IPR curves fell close to a single shape.
Vogel's equation needs only one test point and the average reservoir pressure to find the maximum rate and then the whole curve. It was derived for saturated reservoirs with no skin and no water, yet it works surprisingly well in many fields because the curvature it describes, caused by gas near the well, is a general effect. For wells with significant skin or high water cut, modified forms exist, and a well with multiple test points can be fitted with its own exponent.
The composite curve for undersaturated reservoirs
Many reservoirs start above the bubble point. Above it, the IPR is a straight line; below it, the Vogel shape applies. The composite IPR joins them at the bubble point, using the same J for both parts so the curve is smooth. The rate at the bubble point is J times the drawdown down to the bubble point, and below it the extra rate follows Vogel's shape, with a maximum extra rate of J times the bubble-point pressure divided by 1.8.
To use the composite curve, the engineer first finds J from a test. If the test was above the bubble point, J is simply rate over drawdown. If it was below, J is found by solving the composite equation for J with the test rate and pressure. The program below does both.
# Inflow performance of a vertical oil well: straight-line PI above the bubble point, Vogel below it (composite IPR)
SI = False
if SI:   # vertical Cardium well 102/06-14 after its acid job; kPa and m3/d
    u, ru = "kPa", "m3/d"; pr, pb = 14090.0, 12800.0
    q_test, pwf_test = 30.0, 8000.0          # test below the bubble point
    grid = [14090, 12800, 10000, 8000, 6000, 4000, 2000, 0]
    fk = [(8000.0, 30.0), (5000.0, 38.0)]    # two tests below the bubble point
else:    # vertical Mission Canyon well after its acid job; psi and STB/d
    u, ru = "psi", "STB/d"; pr, pb = 3400.0, 1800.0
    q_test, pwf_test = 384.0, 2200.0         # test above the bubble point
    grid = [3400, 2800, 2200, 1800, 1400, 1000, 500, 0]
    fk = [(1500.0, 590.0), (1000.0, 657.0)]  # two later tests below the bubble point
def vogel_frac(p):                           # Vogel's dimensionless curve for p <= pb
    x = p / pb; return 1 - 0.2 * x - 0.8 * x * x
# find J from the test, using the straight line above pb and Vogel's shape below it
if pwf_test >= pb:
    J = q_test / (pr - pwf_test)
else:
    J = q_test / ((pr - pb) + pb / 1.8 * (1 - 0.2 * pwf_test / pb - 0.8 * (pwf_test / pb) ** 2))
qb = J * (pr - pb)                           # rate at the bubble point
qmax = qb + J * pb / 1.8                     # composite absolute open flow
def q(pwf):
    return J * (pr - pwf) if pwf >= pb else qb + J * pb / 1.8 * vogel_frac(pwf)
print(f"productivity index J = {J:.4f} {ru} per {u}; rate at bubble point {qb:.1f} {ru}; AOF {qmax:.1f} {ru}")
print(f"   pwf ({u})   rate ({ru})   straight-line PI would give")
for p in grid:
    print(f"   {p:8,.0f}   {q(p):10.1f}   {J * (pr - p):10.1f}")
# Fetkovich: q = C (pr^2 - pwf^2)^n fitted to two test points
import math
(p1, q1), (p2, q2) = fk
n = math.log(q2 / q1) / math.log((pr**2 - p2**2) / (pr**2 - p1**2))
Cf = q1 / (pr**2 - p1**2) ** n
print(f"Fetkovich fit to two tests: n = {n:.2f}, AOF = {Cf * pr**(2*n):.1f} {ru}; Vogel predicts {q(p1):.1f} and {q(p2):.1f} at those tests")productivity index J = 0.3200 STB/d per psi; rate at bubble point 512.0 STB/d; AOF 832.0 STB/d
pwf (psi) rate (STB/d) straight-line PI would give
3,400 0.0 0.0
2,800 192.0 192.0
2,200 384.0 384.0
1,800 512.0 512.0
1,400 627.4 640.0
1,000 717.4 768.0
500 794.5 928.0
0 832.0 1088.0
Fetkovich fit to two tests: n = 0.85, AOF = 709.8 STB/d; Vogel predicts 600.9 and 717.4 at those tests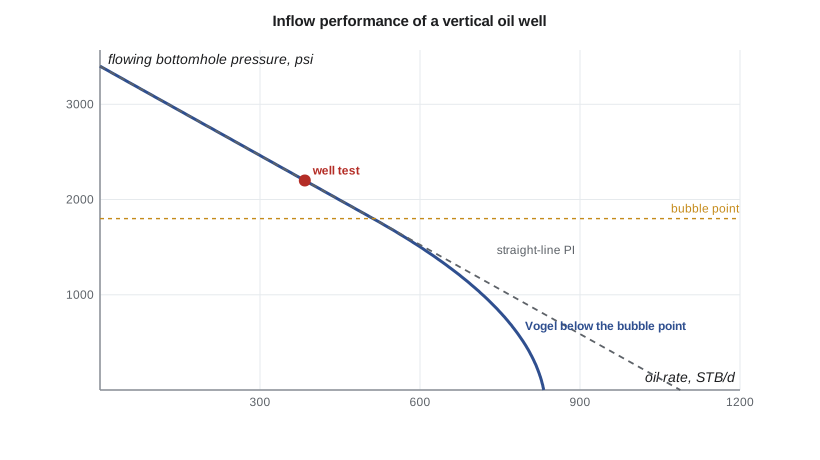
For the Tamarack 7-15 well, the reservoir pressure is about 3,400 psi and the bubble point 1,800 psi, so the well is undersaturated, and its test at 2,200 psi is above the bubble point. The straight-line part gives J = 0.32 STB/d per psi, the rate at the bubble point is 512 STB/d and the composite AOF is about 832 STB/d. The straight-line PI would predict 1,088 STB/d at zero pressure, an overestimate of about 30 percent. The practical question is what lift could achieve. Lowering the bottomhole pressure from 2,200 to about 1,000 psi would raise the rate from 384 to about 717 STB/d, nearly doubling it. Going on to 500 psi adds only another 77 STB/d. Marisol's rule of thumb is that pulling a well far below its bubble point rarely pays, because the gain is small and the pump struggles with free gas.
Fetkovich's backpressure equation
Gas well engineers have long used a backpressure equation of the form q = C(p̄² − p²_wf)ⁿ, where n is between about 0.5 and 1. Fetkovich showed in 1973 that oil wells tested at several rates follow the same form, with the pressure-squared term reflecting the change in mobility as gas comes out of solution.
Two or more stabilized tests at different rates give C and n. An exponent near 1 means the flow is close to laminar Darcy flow; lower values indicate turbulence near the well or other rate-dependent effects. The Fetkovich form is most useful when a well has several reliable tests, because it uses the well's own data rather than a generic curve. The test type matters: the classic method is a multirate test (often a four-point flow-after-flow test in gas wells) or an isochronal test, in which each flow period starts from shut-in conditions so that transient effects are the same.
Fitting the Tamarack 7-15 well's two later tests, both below the bubble point, gives n = 0.85 and an AOF of about 710 STB/d, lower than the composite curve's 832. Vogel also predicts 601 and 717 STB/d at those tests, where the well actually made 590 and 657. The composite curve slightly overestimates at the lowest pressures, perhaps because water or skin affects the shape. Marisol prefers to plan with the Fetkovich curve, which comes from the well's own data, until a new test is run.
Water, skin and other complications
Real wells are not as tidy as the equations. Water production changes the IPR in two ways: water has no dissolved gas and its relative permeability is not affected by gas near the well, so the total liquid IPR of a high-water-cut well is closer to a straight line than Vogel's curve. Several authors proposed combined oil-and-water IPRs that weight a straight-line water curve and a Vogel oil curve by the water cut.
Skin also changes the shape. Vogel's original curve assumed no skin. For damaged wells, Standing proposed using flow efficiency to correct the dimensionless curve, so that the same test gives a different maximum rate for a damaged and an undamaged well. In practice, many engineers fit the curve to the well's own tests, which captures skin implicitly, and redo the fit after any stimulation or workover.
Finally, the IPR is not fixed. As the reservoir depletes, the average pressure falls and the whole curve shifts to the left. Below the bubble point, the gas saturation near the well also rises, which reduces J. Fetkovich and others proposed methods to predict future IPRs, but the most reliable approach is to keep testing. Marisol schedules a pressure buildup on each of her key wells once a year.
Worked problem
How much more could a pump deliver?
A vertical Mission Canyon well has p̄ = 3,400 psi, pb = 1,800 psi and J = 0.32 STB/d per psi. Its bottomhole pressure is 2,200 psi. Estimate the rate at 2,200 psi and at 1,200 psi.
Show solution
- Above pb the line is straight: q = 0.32 × (3,400 − 2,200) = 384 STB/d.
- Rate at the bubble point: qb = 0.32 × 1,600 = 512 STB/d; Vogel part maximum = 0.32 × 1,800/1.8 = 320 STB/d.
- At 1,200 psi, x = 1,200/1,800 = 0.667: 1 − 0.133 − 0.356 = 0.511, so q = 512 + 320 × 0.511 = 676 STB/d.
- The gain is 292 STB/d, about 76 percent, for lowering the bottomhole pressure by 1,000 psi.
Answer: The IPR answers the first question in any lift decision: how much more the reservoir can give if the well is pumped harder.
Getting the bottomhole pressure in a pumping well
A flowing well can carry a bottomhole gauge, but many pumping wells have no downhole gauge at all. Their flowing bottomhole pressure is estimated from an acoustic fluid level: a sound pulse fired into the casing annulus reflects from the top of the liquid, and the time of the echo gives its depth. The bottomhole pressure is then the casing pressure plus the weight of the gas column plus the weight of the liquid column below the fluid level, allowing for gas bubbling through that liquid. Fluid levels are cheap and quick, so field teams shoot them often, but they carry several sources of error, such as foam, uncertain liquid density and the gas-cut gradient. Marisol tells Ethan to trust a trend of fluid levels more than any single shot, and to calibrate them against a gauge whenever a well is worked over.
Many newer pumping wells also have a pressure sensor at the pump intake, wired to the surface through the pump cable or a separate line. Intake pressure is measured continuously, so the IPR can be checked every time the pump speed changes.
Common mistakes
MistakeUsing a straight-line PI below the bubble point.
InsteadUse Vogel or a composite curve; the straight line overestimates rate at low pressure.
MistakeCalculating J from a test without a current reservoir pressure.
InsteadUse a recent buildup or static pressure; an old value distorts J.
MistakeTreating AOF as an achievable rate.
InsteadAOF is a theoretical limit at zero bottomhole pressure.
MistakeApplying Vogel's curve to high-water-cut wells without adjustment.
InsteadUse a combined oil-water IPR or fit the well's own tests.
MistakeAssuming the IPR stays constant for years.
InsteadRetest; depletion and gas saturation shift the curve.
Summary and key terms
- The IPR relates rate to flowing bottomhole pressure; it is the supply side of the system.
- Above the bubble point, rate is proportional to drawdown through the productivity index.
- Below the bubble point, Vogel's curve captures the loss of oil mobility near the well.
- The composite IPR joins a straight line and a Vogel curve at the bubble point.
- Fetkovich's backpressure form uses multirate tests to fit the well's own exponent.
- Water, skin and depletion all change the curve, so wells must be retested.
- Inflow performance relationship (IPR)
- The rate a reservoir delivers to a well as a function of flowing bottomhole pressure.
- Productivity index
- Rate divided by drawdown for single-phase flow.
- Drawdown
- Average reservoir pressure minus flowing bottomhole pressure.
- Absolute open flow
- The theoretical rate at zero flowing bottomhole pressure.
- Composite IPR
- A straight line above the bubble point joined to a Vogel curve below it.
- Backpressure equation
- An IPR of the form q = C(p̄² − pwf²)ⁿ.
- Isochronal test
- A multirate test in which each flow period starts from shut-in, so transients are comparable.
Practice problems
Work each problem on paper first, then reveal the answer to check.
Why does the IPR curve below the bubble point?
Show answer
Free gas near the well reduces oil relative permeability and raises oil viscosity.
A well tests 50 units of rate at a drawdown of 1,000 units above the bubble point. What is J?
Show answer
0.05 rate units per pressure unit.
What does a Fetkovich exponent of 0.6 suggest?
Show answer
Significant rate-dependent effects such as turbulence near the well.
Why is AOF still useful even though it cannot be reached?
Show answer
It is a convenient single measure of well capacity and a reference for comparing wells.
Lesson quiz · 5 questions
Score 60% or more to complete this lesson.
Create a free account to save your progress, take quizzes and earn a certificate.