
PET-320 · Lesson 6 of 12 · 18 min
Depletion drive and gas cap drive reservoirs
The study's next question is what happens if nothing is done. 'Suppose we just keep producing,' Lena says. 'The unit has about 1,300 psi left before it reaches the bubble point. After that it becomes a solution-gas drive reservoir. I want to know how the gas-oil ratio will behave, how fast the pressure will fall, and how much oil we will get before the wells are uneconomic. That is the base case every other plan has to beat.'
Reservoirs produce because something pushes the oil toward the wells. The sources of that push are called drive mechanisms. This lesson covers the two that depend on gas: solution-gas drive, also called depletion drive, where gas coming out of the oil supplies the energy, and gas-cap drive, where a cap of free gas above the oil expands. Lesson 7 covers water drive. Most real reservoirs combine several mechanisms, and the material balance can measure the share of each.
The drive mechanisms
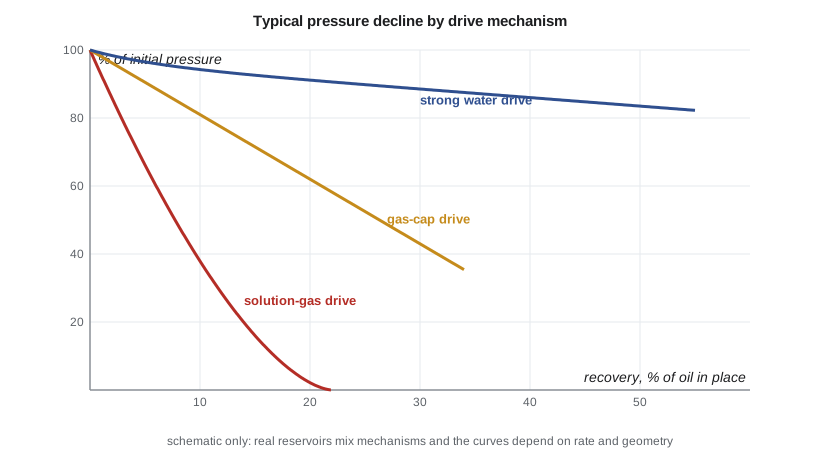
Six sources of energy can drive oil to wells: expansion of the oil and its dissolved gas above the bubble point; liberation and expansion of solution gas below it; expansion of a gas cap; water influx from an aquifer; compaction of the rock and expansion of connate water; and gravity drainage, where oil drains downward under its own weight in a steeply dipping or thick reservoir with good vertical permeability. Each gives a characteristic pattern of pressure, gas-oil ratio and water production, and each gives a typical range of recovery.
Solution-gas drive
In a solution-gas drive reservoir there is no gas cap and no active aquifer. Above the bubble point, production comes from liquid and rock expansion and the pressure falls rapidly. Once the pressure falls below the bubble point, gas comes out of solution throughout the oil zone. At first the gas bubbles are isolated: until the gas saturation reaches the critical gas saturation, the gas cannot flow, so it stays in the rock, expands and pushes oil out. During this period the producing gas-oil ratio may even fall slightly below the initial solution gas-oil ratio, because the oil reaching the wells has lost some of its dissolved gas.
Once the gas saturation exceeds the critical value, gas begins to flow. Because gas is much less viscous than oil, often 50 times less, it flows far faster than oil at the same saturation. The producing gas-oil ratio climbs steeply, the energy stored in the gas leaves through the wells instead of pushing oil, and the pressure falls quickly. Oil saturation falls, oil relative permeability falls and oil viscosity rises as the dissolved gas leaves, so oil rates decline steeply. Eventually the gas-oil ratio peaks and falls again as the reservoir runs out of gas pressure.
Recovery from solution-gas drive is low, typically 10 to 25 percent of the oil in place for black oils, sometimes a little more for light oils with high gas-oil ratios. It depends on the critical gas saturation, the shape of the relative permeability curves, the oil viscosity and the abandonment pressure. Higher oil viscosity and lower critical gas saturation reduce recovery, because the gas escapes more easily.
Predicting solution-gas drive: Muskat's method
Several methods predict solution-gas drive performance by combining the material balance with the gas-oil ratio equation. The instantaneous producing gas-oil ratio is the gas dissolved in the produced oil plus the free gas flowing alongside it, in proportion to the gas and oil mobilities.
Tarner's method guesses the production over each pressure step and iterates until the material balance and the gas-oil ratio equation agree. Muskat's method writes the same physics as a differential equation for the rate of change of oil saturation with pressure, which a computer can integrate step by step. Both assume a uniform reservoir with no gravity segregation, and both use the same PVT and relative permeability data. Their results are good first estimates of recovery and gas-oil ratio, though real reservoirs with gravity segregation of gas into a secondary gas cap often do better.
Oil recovery since the bubble point follows from the oil saturation at each pressure, because the oil remaining in stock-tank units is the pore volume times So divided by Bo.
# Solution-gas drive below the bubble point by Muskat's method, with Standing PVT (approximate)
import math
SI = False
api, gg, T_F, pb = (38.0, 0.80, 140.0, 1856.0) if SI else (42.0, 0.85, 240.0, 2600.0)
swc = 0.30 if SI else 0.35
p_ab = 3000 / 6.895 if SI else 500.0           # abandonment pressure, psia
above = 0.008 if SI else 0.069                  # recovery above the bubble point (lesson 4)
go = 141.5 / (131.5 + api)
rs = lambda p: gg * ((p / 18.2 + 1.4) * 10 ** (0.0125 * api - 0.00091 * T_F)) ** 1.2048      # scf/STB
bo = lambda p: 0.9759 + 0.00012 * (rs(p) * math.sqrt(gg / go) + 1.25 * T_F) ** 1.2              # rb/STB
z = lambda p: 1.0 - 0.00006 * p                 # rough gas deviation factor (assumed)
bg = lambda p: 0.005035 * z(p) * (T_F + 459.67) / p                                                # rb/scf
mu_o = lambda p: (0.70 if SI else 0.29) * (1 + 0.45 * (1 - p / pb))                               # cP (assumed trend)
mu_g = lambda p: 0.012 + 2.5e-6 * p                                                               # cP (assumed)
sgc, sorg, krg0, kro0, ng, no = 0.05, 0.15, 0.60, 0.85, 2.5, 2.0
def ratio(so):                                  # krg/kro from Corey curves
    sg = 1 - swc - so
    if sg <= sgc: return 0.0
    krg = krg0 * min(1.0, (sg - sgc) / (1 - swc - sgc)) ** ng
    kro = kro0 * max(1e-9, (so - sorg) / (1 - swc - sorg)) ** no
    return krg / kro
d = lambda f, p, h=1.0: (f(p + h) - f(p - h)) / (2 * h)
so, p, dp = 1 - swc, pb, 5.0
print("pressure     So    recovery since pb    producing GOR")
nextp = pb
while p > p_ab:
    if p <= nextp + 1e-6:
        R = rs(p) + ratio(so) * mu_o(p) * bo(p) / (mu_g(p) * bg(p))
        rec = 1 - (so / bo(p)) * bo(pb) / (1 - swc)
        if SI: print(f"{p*6.895:7,.0f} kPa  {so:.3f}      {rec:6.1%}            {R/5.615:6,.0f} m3/m3")
        else:  print(f"{p:6,.0f} psia  {so:.3f}      {rec:6.1%}            {R:7,.0f} scf/STB")
        nextp -= (pb - p_ab) / 6
    lam = mu_o(p) / mu_g(p) * ratio(so)
    num = so * bg(p) / bo(p) * d(rs, p) + so * lam / bo(p) * d(bo, p) - (1 - so - swc) * bg(p) * d(lambda x: 1 / bg(x), p)
    so -= dp * num / (1 + lam); p -= dp
rec = 1 - (so / bo(p)) * bo(pb) / (1 - swc)
total = above + (1 - above) * rec
print(f"recovery at abandonment: {rec:.1%} of the oil at the bubble point; {total:.1%} of the original oil in place")pressure So recovery since pb producing GOR 2,600 psia 0.650 0.0% 795 scf/STB 2,250 psia 0.590 4.6% 669 scf/STB 1,900 psia 0.535 9.0% 621 scf/STB 1,550 psia 0.489 12.6% 735 scf/STB 1,200 psia 0.453 15.1% 939 scf/STB 850 psia 0.425 16.7% 1,083 scf/STB recovery at abandonment: 17.9% of the oil at the bubble point; 23.5% of the original oil in place
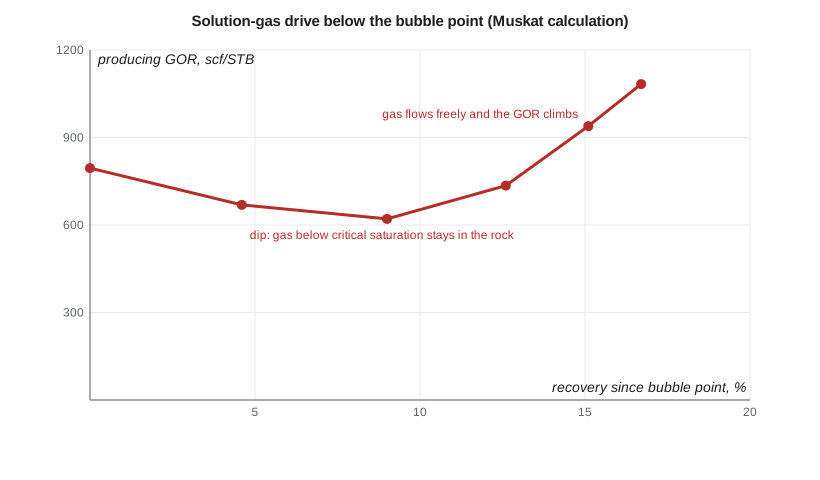
For the study unit, the Muskat calculation shows the classic pattern. The gas-oil ratio dips from about 795 to about 620 scf/STB in the first several percent of recovery below the bubble point, then climbs past 1,000 scf/STB as the gas begins to flow. Recovery to an abandonment pressure of 500 psia is about 18 percent of the oil at the bubble point, and with the larger expansion recovery above it, about 23 percent of the original oil in place. Lena cautions that this is a tank calculation for a fractured tight reservoir, which drains only the rock near the fractures; real Bakken wells recover far less of the whole unit's oil, so the useful lesson here is the shape of the gas-oil ratio, not the recovery number.
Gas-cap drive
When a reservoir starts with more gas than the oil can dissolve, the free gas collects in a gas cap above the oil. As oil is produced and the pressure falls, the gas cap expands downward into the oil zone, pushing oil toward wells completed low in the oil column. Because a large gas volume expands considerably for a small pressure drop, pressure falls more slowly than in solution-gas drive, and recovery is higher, typically 25 to 40 percent, sometimes more with gravity drainage.
The size of the gas cap is described by m, the ratio of the initial gas cap reservoir volume to the initial oil zone reservoir volume. In the material balance, the gas cap term m Eg adds to the oil expansion. With both N and m unknown, Havlena and Odeh suggested plotting F/Eo against Eg/Eo, which gives a straight line with intercept N and slope m N. If m is known from logs and contacts, a single plot of F against Eo + m Eg gives N.
Good practice in a gas-cap reservoir protects the gas cap's energy. Wells are completed as far below the gas-oil contact as possible, and production rates are kept low enough to avoid gas coning, where the pressure drawdown at a well pulls gas down through the oil. Producing gas-cap gas early wastes the drive energy and lowers oil recovery, which is why regulators in many jurisdictions restrict the production of gas from gas caps over oil.
Drive indices
Dividing each term of the material balance by the withdrawal F gives the fraction of the production supported by each mechanism. These fractions, the drive indices, sum to one, and their change over time shows how the reservoir's behavior is evolving.
The four terms are the depletion drive index, the gas-cap drive index, the compaction and connate water index and the water drive index. A reservoir dominated by its depletion index will behave like a solution-gas drive reservoir, while a rising water drive index tells the engineer that the aquifer is increasingly important.
Production practices and regulation
Because high gas-oil ratios waste reservoir energy and, if the gas cannot be captured, waste the gas itself, regulators watch gas-oil ratios. In North Dakota, the North Dakota Industrial Commission (NDIC) has set gas capture targets for operators and can restrict oil production from wells whose gas is not being captured. Engineers planning a depletion case must therefore include the cost of gathering and processing the associated gas.
For the base case, Lena asks Ethan to forecast the gas-oil ratio year by year so that Sofia Reyes in facilities can check whether the existing gas gathering and compression can handle the peak. If not, the base case needs a compression project, and its cost must be included before the waterflood option is compared against it.
Worked problem
Gas cap material balance
A saturated reservoir with a gas cap has Bti = 1.320 rb/STB and Bgi = 0.00107 rb/scf. At a lower pressure, Bt = 1.395 rb/STB and Bg = 0.00128 rb/scf. The gas cap ratio is m = 0.40, and the reservoir withdrawal to that pressure is F = 1,760,000 rb. Ignoring Efw and influx, estimate N.
Show solution
- Eo = Bt − Bti = 1.395 − 1.320 = 0.075 rb/STB.
- Eg = Bti (Bg/Bgi − 1) = 1.320 × (0.00128/0.00107 − 1) = 1.320 × 0.196 = 0.259 rb/STB.
- Eo + m Eg = 0.075 + 0.40 × 0.259 = 0.075 + 0.104 = 0.179 rb/STB.
- N = F/(Eo + m Eg) = 1,760,000/0.179 = 9.8 MMSTB.
Answer: N ≈ 9.8 MMSTB; the gas cap supplies 0.104/0.179, or 58 percent, of the drive.
Common mistakes
MistakeExpecting the gas-oil ratio to rise as soon as pressure falls below the bubble point.
InsteadIt often dips first, until gas saturation exceeds the critical value.
MistakeCompleting wells near the gas-oil contact to get high rates.
InsteadComplete low in the oil column and limit drawdown to avoid gas coning.
MistakeProducing gas-cap gas early for quick revenue.
InsteadGas-cap gas is the reservoir's drive energy; producing it lowers oil recovery.
MistakeTreating Muskat recovery as exact.
InsteadIt assumes no gravity segregation and uniform properties; use it as a base estimate.
MistakeForgetting the cost of handling rising gas production.
InsteadInclude gas gathering, compression or conservation in the depletion case.
Summary and key terms
- Drive mechanisms include fluid and rock expansion, solution gas, gas cap, water influx, compaction and gravity drainage.
- Solution-gas drive gives a rapid pressure decline, a rising gas-oil ratio and recovery of about 10 to 25 percent.
- The producing gas-oil ratio equals Rs plus a free gas term set by the gas-oil mobility ratio.
- Tarner's and Muskat's methods combine material balance with the gas-oil ratio equation to forecast recovery.
- Gas-cap drive holds pressure better and typically recovers 25 to 40 percent.
- Drive indices, from the material balance terms, show the share of each mechanism.
- Solution-gas drive
- Production driven by gas coming out of solution and expanding below the bubble point.
- Gas-cap drive
- Production driven by the expansion of a free gas cap above the oil.
- Critical gas saturation
- The gas saturation above which free gas begins to flow.
- Producing gas-oil ratio
- The ratio of gas to oil produced at a given time.
- Gas coning
- Gas drawn down from a gas cap into a well by the pressure drawdown.
- Drive index
- The fraction of the reservoir withdrawal supported by one drive mechanism.
- Muskat method
- A differential form of the material balance and gas-oil ratio equations for solution-gas drive.
Practice problems
Work each problem on paper first, then reveal the answer to check.
Why does the producing gas-oil ratio of a solution-gas drive reservoir eventually fall again late in life?
Show answer
The reservoir runs low on gas pressure and remaining gas, so less gas flows.
How does higher oil viscosity affect solution-gas drive recovery?
Show answer
It lowers recovery, because the gas flows even more easily relative to the oil and escapes.
In a gas-cap reservoir, what does a straight line of F/Eo against Eg/Eo give?
Show answer
Intercept N and slope m N.
Drive indices at one date are depletion 0.35, gas cap 0.50 and compaction 0.15. What is the water drive index?
Show answer
Zero, since the indices sum to one.
Lesson quiz · 5 questions
Score 60% or more to complete this lesson.
Create a free account to save your progress, take quizzes and earn a certificate.