
PET-320 · Lesson 3 of 12 · 19 min
Fluid properties for reservoir engineering
Nadia Petrov, who builds the reservoir models, sends Ethan the PVT report for the Bakken pool: a bottomhole sample from an early well in the unit, with a constant composition expansion, a differential liberation and separator tests. 'You learned how these are measured in PET-260,' she says. 'For reservoir engineering we need them as tables: Bo, Rs, Bg and viscosity against pressure, at reservoir temperature. Every equation in this course uses them. Get them wrong and every answer is wrong in the same direction.'
This lesson reviews the fluid properties a reservoir engineer uses, how they change with pressure, and how they are estimated when laboratory data are missing. It treats the reservoir fluid with the black-oil model, the simplest description that captures gas coming out of oil, which is adequate for black oils and many light oils. Volatile oils and condensates need compositional methods, introduced in PET-260.
The black-oil model
The black-oil model treats the reservoir fluid as two surface components, stock-tank oil and surface gas, which can exist in two reservoir phases, oil and gas. Gas can dissolve in the oil phase, but oil does not vaporize into the gas phase. Three functions of pressure, at the fixed reservoir temperature, describe how the surface components distribute between the phases and how much space they take up.
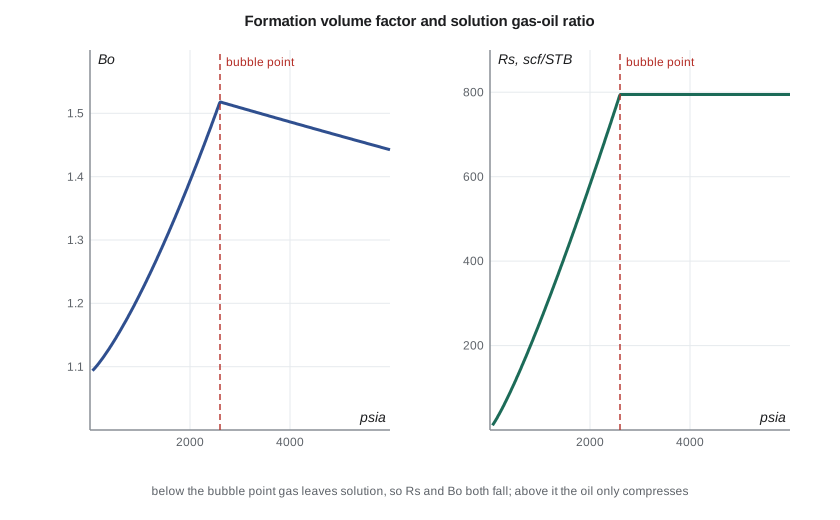
The solution gas-oil ratio, Rs, is the volume of surface gas dissolved in each unit volume of stock-tank oil. Above the bubble point it is constant at its initial value Rsi, because all the gas is in solution. Below the bubble point, gas leaves solution as pressure falls, so Rs decreases. The oil formation volume factor, Bo, is the reservoir volume occupied by one stock-tank volume of oil together with its dissolved gas. Above the bubble point, Bo increases slightly as pressure falls, because the liquid expands. Below the bubble point, Bo decreases, because gas leaves solution and the oil shrinks. The gas formation volume factor, Bg, is the reservoir volume of one standard volume of free gas.
Two more combinations are useful. The total formation volume factor, Bt = Bo + Bg (Rsi − Rs), is the reservoir volume occupied by one stock-tank volume of oil and the gas originally dissolved in it, whether that gas is still in solution or now free. The undersaturated oil compressibility, co, describes how Bo changes above the bubble point.
Units and conversions
In oilfield units, Rs is in standard cubic feet per stock-tank barrel (scf/STB), Bo in reservoir barrels per stock-tank barrel (rb/STB), and Bg either in reservoir cubic feet per scf or reservoir barrels per scf; dividing ft³/scf by 5.615 gives rb/scf. Material balance equations need Bg and Bo in the same volume unit, so convert Bg to rb/scf whenever it is combined with Bo. Many mistakes in field calculations come from mixing those two units.
Laboratory data: which experiment to use
PVT reports contain several experiments, and the choice matters. The constant composition expansion measures the bubble point and the compressibility above it. The differential liberation removes the gas at each pressure step, imitating, roughly, what happens in the reservoir once free gas becomes mobile and flows away from the oil. Separator tests flash the reservoir oil through the field's separator stages to stock-tank conditions, giving the Bo and Rs that match field production measurements.
Differential liberation values are not used directly, because they are referred to a residual oil at reservoir temperature rather than to stock-tank oil from the real separators. The standard practice, described in PET-260, adjusts the differential data with the separator-test Bob and Rsb to give Bo and Rs referred to stock-tank oil. Reservoir engineers should check which values a report or a simulation deck is using, because the difference in Bo can be several percent.
Correlations when data are missing
Many pools, especially small ones, have no reliable PVT sample. Engineers then use empirical correlations fitted to large laboratory datasets. Standing's correlations, from California crude oils, estimate the bubble point and Rs from gas gravity, oil API gravity and temperature, and Bo from Rs and the same properties. The Vasquez-Beggs and Glasø correlations are alternatives fitted to wider data. For viscosity, the Beggs-Robinson correlation estimates dead-oil viscosity from API gravity and temperature, then corrects it for dissolved gas.
In Standing's equations, p is in psia, T in degrees Fahrenheit, Rs in scf/STB and γg and γo are the gas and oil specific gravities. The coefficients are approximate, and correlations typically carry errors of 5 to 15 percent in bubble point and a few percent in Bo for oils like those in their datasets, and more for others. They are a starting point, to be replaced by laboratory data when it exists, and checked against field data such as the initial producing gas-oil ratio.
Gas properties: the z-factor
The z-factor corrects the ideal gas law, pV = z n R T. It depends on reduced pressure and temperature, the actual values divided by the pseudocritical values of the gas mixture, which can be estimated from the gas gravity when the composition is unknown. The Standing-Katz chart gives z against reduced pressure and temperature, and equations such as Hall-Yarborough or Dranchuk-Abou-Kassem reproduce it for computer use. Acid gases such as carbon dioxide and hydrogen sulfide need corrections such as Wichert-Aziz.
For typical reservoir gases, z falls from 1 at low pressure to a minimum of about 0.8 to 0.9 at moderate pressure, then rises again at high pressure, exceeding 1 in deep, overpressured reservoirs. This behavior matters directly in the p/z material balance of lesson 8.
# Black-oil PVT table from Standing and Beggs-Robinson correlations (approximate), and gas z by Hall-Yarborough
import math
SI = False
api, gg, T_F = (38.0, 0.80, 140.0) if SI else (42.0, 0.85, 240.0)
pb = 1856.0 if SI else 2600.0          # bubble point, psia (ca value is 12,800 kPa)
pi = 15300 / 6.895 if SI else 5370.0   # initial pressure, psia
co = 1.4e-5 if SI else 1.5e-5          # undersaturated oil compressibility, 1/psi (assumed)
go = 141.5 / (131.5 + api)
def rs(p):        # scf/STB, Standing; constant above pb
    p = min(p, pb)
    return gg * ((p / 18.2 + 1.4) * 10 ** (0.0125 * api - 0.00091 * T_F)) ** 1.2048
def bo(p):        # rb/STB
    b = 0.9759 + 0.00012 * (rs(p) * math.sqrt(gg / go) + 1.25 * T_F) ** 1.2
    return b * math.exp(-co * (p - pb)) if p > pb else b
def muo(p):       # cP, Beggs-Robinson dead and live oil; above pb a simple linear rise (assumed)
    x = 10 ** (3.0324 - 0.02023 * api) * T_F ** -1.163
    dead = 10 ** x - 1
    live = 10.715 * (rs(p) + 100) ** -0.515 * dead ** (5.44 * (rs(p) + 150) ** -0.338)
    return live * (1 + 0.00008 * (p - pb)) if p > pb else live
pts = [pi, pb + 0.6 * (pi - pb), pb, 0.75 * pb, 0.5 * pb, 0.25 * pb]
print("pressure      Rs           Bo        oil viscosity")
for p in pts:
    if SI: print(f"{p*6.895:7,.0f} kPa {rs(p)/5.615:6.1f} m3/m3 {bo(p):6.3f}   {muo(p):5.2f} mPa.s")
    else:  print(f"{p:6,.0f} psia {rs(p):6.0f} scf/STB {bo(p):6.3f}   {muo(p):5.2f} cP")
# Hall-Yarborough z factor for the gas pool (Sutton pseudo-criticals for gas gravity 0.65)
def z_hy(Tpr, Ppr):
    t = 1.0 / Tpr; A = 0.06125 * t * math.exp(-1.2 * (1 - t) ** 2)
    B = t * (14.76 - 9.76 * t + 4.58 * t * t); Cc = t * (90.7 - 242.2 * t + 42.4 * t * t); D = 2.18 + 2.82 * t
    y = 0.001
    for _ in range(100):
        f = -A * Ppr + (y + y*y + y**3 - y**4) / (1 - y) ** 3 - B * y * y + Cc * y ** D
        df = (1 + 4*y + 4*y*y - 4*y**3 + y**4) / (1 - y) ** 4 - 2 * B * y + Cc * D * y ** (D - 1)
        y -= f / df
    return A * Ppr / y
ggas = 0.65; Tpc = 169.2 + 349.5 * ggas - 74.0 * ggas ** 2; Ppc = 756.8 - 131.0 * ggas - 3.6 * ggas ** 2
Tg = 167 + 459.67
for p in ((3045.0, 2000.0, 1000.0) if SI else (3050.0, 2000.0, 1000.0)):
    z = z_hy(Tg / Tpc, p / Ppc)
    if SI: print(f"gas at {p*6.895:6,.0f} kPa and 75 C: z = {z:.3f}, Bg = {(101.325/(p*6.895))*(348.15/288.15)*z:.5f} rm3/sm3")
else: print(f"gas at {p:5,.0f} psia and 167 F: z = {z:.3f}, Bg = {0.02827*z*Tg/p:.5f} ft3/scf")pressure Rs Bo oil viscosity 5,370 psia 795 scf/STB 1.456 0.35 cP 4,262 psia 795 scf/STB 1.481 0.33 cP 2,600 psia 795 scf/STB 1.518 0.29 cP 1,950 psia 564 scf/STB 1.383 0.34 cP 1,300 psia 349 scf/STB 1.264 0.40 cP 650 psia 155 scf/STB 1.163 0.53 cP gas at 3,050 psia and 167 F: z = 0.876, Bg = 0.00509 ft3/scf gas at 2,000 psia and 167 F: z = 0.871, Bg = 0.00771 ft3/scf gas at 1,000 psia and 167 F: z = 0.917, Bg = 0.01625 ft3/scf
The table reproduces the report closely. With 42° API oil, a gas gravity of 0.85 and 240 °F, Standing gives Rsb of about 795 scf/STB at the 2,600 psia bubble point and Bob of about 1.52. At the initial 5,370 psia, Boi is 1.456. Below the bubble point, Rs and Bo fall and the oil viscosity rises from about 0.29 to 0.53 cP at 650 psia, because the light components that thin the oil have left. Nadia keeps the laboratory values for the model but notes that the correlation agrees within a few percent.
Viscosity and water properties
Oil viscosity controls how easily oil flows, so it appears in every inflow and displacement calculation. It falls with temperature, is higher for heavier, lower-API oils, and depends strongly on dissolved gas: below the bubble point, as gas leaves solution, viscosity rises. Gas viscosity is much lower, typically 0.01 to 0.03 mPa·s or cP, and rises with pressure. The large contrast between oil and gas viscosity is why free gas, once it is mobile, flows to wells so easily.
Formation water properties are often treated as constants: Bw close to 1.0 to 1.05, water compressibility about 3 × 10⁻⁶ per psi, and viscosity of about 0.3 to 1.0 mPa·s or cP depending on temperature and salinity. They matter in water-drive and waterflood calculations and in the material balance term for connate water expansion.
Checking PVT data
Before using a PVT report, reservoir engineers check that the sample is representative. Was it taken before the reservoir pressure fell below the bubble point near the well? Does the laboratory bubble point agree with field evidence such as the pressure at which the producing gas-oil ratio began to rise? Does the measured Rsb agree with the initial producing gas-oil ratio? Is the stock-tank gravity consistent with produced oil? A sample taken after free gas has formed around the well gives a gas-oil ratio that is too high and a bubble point equal to the sampling pressure, both misleading.
The Bakken pool sample passes these checks: it was taken early, well above the bubble point, and its 795 scf/STB is close to the producing gas-oil ratio of the unit's first months.
Worked problem
Using a PVT table
At 1,950 psia the table gives Rs = 564 scf/STB and Bo = 1.383; Rsi = 795 scf/STB and Bg at 1,950 psia is 0.00145 rb/scf. Find the total formation volume factor and the reservoir volume of gas released from each stock-tank barrel of oil.
Show solution
- Gas released = Rsi − Rs = 795 − 564 = 231 scf per STB.
- Its reservoir volume = 231 × 0.00145 = 0.335 rb.
- Bt = Bo + Bg (Rsi − Rs) = 1.383 + 0.335 = 1.718 rb/STB.
Answer: Bt ≈ 1.72 rb/STB; 0.34 rb of free gas per STB.
Common mistakes
MistakeMixing Bg in ft³/scf with Bo in rb/STB.
InsteadConvert Bg to rb/scf (divide by 5.615) before combining it with Bo.
MistakeUsing differential liberation Bo and Rs directly.
InsteadAdjust them to stock-tank conditions with separator-test values.
MistakeAssuming Rs keeps rising above the bubble point.
InsteadRs is constant above the bubble point; only Bo changes slightly.
MistakeTrusting a sample taken below the bubble point.
InsteadCheck sampling conditions; such samples give misleading bubble points and gas-oil ratios.
MistakeTreating correlations as exact.
InsteadCorrelations carry errors of several percent or more and should be checked against field data.
Summary and key terms
- The black-oil model uses Rs, Bo and Bg against pressure at reservoir temperature.
- Above the bubble point Rs is constant and Bo rises slightly as pressure falls; below it, both Rs and Bo fall.
- Bt = Bo + Bg (Rsi − Rs) is the volume of oil plus originally dissolved gas.
- Differential liberation data must be adjusted with separator tests to give stock-tank based values.
- Standing and similar correlations estimate PVT properties when data are missing, with errors of several percent.
- The z-factor corrects gas behavior and is estimated from reduced pressure and temperature.
- Oil viscosity rises below the bubble point as gas leaves solution.
- Solution gas-oil ratio (Rs)
- Surface gas dissolved per unit of stock-tank oil.
- Oil formation volume factor (Bo)
- Reservoir volume of oil and dissolved gas per unit of stock-tank oil.
- Total formation volume factor (Bt)
- Reservoir volume of oil plus the gas originally dissolved in it, per unit of stock-tank oil.
- Differential liberation
- A PVT experiment that removes released gas at each pressure step.
- Separator test
- A PVT experiment flashing reservoir oil through separator stages to stock-tank conditions.
- z-factor
- The gas deviation factor correcting the ideal gas law.
- Black-oil model
- A fluid description with oil and gas surface components, allowing gas to dissolve in oil.
Practice problems
Work each problem on paper first, then reveal the answer to check.
Why does Bo increase slightly as pressure falls above the bubble point?
Show answer
The liquid expands as it decompresses; no gas has yet left solution.
Convert an Rs of 730 scf/STB to m³/m³.
Show answer
About 130 m³/m³.
A sample from a well shows a bubble point equal to the flowing bottomhole pressure at sampling. What do you suspect?
Show answer
Free gas was present around the well, so the sample may not represent the reservoir oil.
Why does oil viscosity rise below the bubble point?
Show answer
The light, low-viscosity components leave solution as gas, leaving a heavier oil.
Lesson quiz · 5 questions
Score 60% or more to complete this lesson.
Create a free account to save your progress, take quizzes and earn a certificate.