
PET-320 · Lesson 12 of 12 · 18 min
Decline curve analysis and the reservoir study
The last piece of the study is the forecast. The 3-22H well has two years of daily production, and the reserves evaluators want its estimated ultimate recovery before year-end. 'Decline curves are the most used tool in the business and the most abused,' Lena says. 'They are simple, which is why everyone uses them. They are empirical, which is why they go wrong. In the Bakken especially, you have to fit them carefully and check them against what you know about the flow. Then pull the whole study together.'
This lesson covers Arps decline curve analysis: the exponential, hyperbolic and harmonic forms, the meaning of the decline exponent, the modified hyperbolic decline used for unconventional wells, and the estimate of ultimate recovery. It then completes the reservoir study begun in lesson 1, reconciling the volumetric, material balance and decline estimates and turning them into a recommendation.
Arps decline curves
In 1945, J. J. Arps observed that the production rate of many wells declines in a pattern that can be described by a simple equation. Define the nominal decline rate D as the fractional rate of change of production rate, D = −(1/q)(dq/dt). Arps found that D often varies with rate as D = Di (q/qi)^b, where b is the decline exponent. Integrating gives the family of curves that bears his name.
Three cases are traditionally recognized. With b = 0 the decline is exponential: D is constant and q = qi e^(−Dt). With b = 1 it is harmonic: q = qi/(1 + Di t). Between them, 0 < b < 1, it is hyperbolic. A well producing at constant flowing pressure in pseudosteady state, with constant compressibility and no change in drive, declines exponentially, so b = 0 has a physical basis (lesson 10). Values of b between 0 and 1 arise from changing drive mechanisms, such as solution-gas drive, and from layered reservoirs that deplete at different rates.
Cumulative production follows from integrating the rate. For hyperbolic decline with b not equal to 0 or 1:
For exponential decline it reduces to Np = (qi − q)/D, a useful check: the remaining reserves of a well in exponential decline are its current rate divided by its decline rate, adjusted to the economic limit.
Nominal and effective decline
Decline rates are quoted in two ways, and confusing them is a common source of error. The nominal decline D is the instantaneous rate defined above, usually per year or per month. The effective decline De is the fractional drop in rate over a period, usually one year: De = (q0 − q1)/q0. For exponential decline, De = 1 − e^(−D). For hyperbolic decline, the effective decline changes with time. Reserves reports and economic software usually specify effective annual declines, so engineers must convert carefully.
Decline exponents above one
Arps believed b would lie between 0 and 1. Multi-stage fractured horizontal wells in tight and shale reservoirs routinely fit b values of 1.2 to 2 or more over their first years. The reason is physical: these wells spend a long time in transient linear flow toward their fractures (lesson 10), for which the theory gives b = 2. Fitting such early data with a hyperbola and extending it for decades predicts far too much oil, because with b greater than 1 the cumulative production keeps growing without limit as time goes on.
The standard remedy is the modified hyperbolic decline. The well follows the fitted hyperbola until its instantaneous nominal decline falls to a terminal value Dmin, typically 5 to 10 percent per year effective, after which the forecast switches to exponential decline at Dmin. The switch represents the onset of boundary-dominated flow, when the drainage areas of neighboring fractures and wells interfere. Reserves evaluators usually require such a terminal decline, and they check the resulting recoveries against analog wells.
Fitting decline curves well
Good decline analysis starts with clean data. Rate changes caused by operations, such as shut-ins, choke changes, artificial lift installation or offset fracturing, distort the decline and must be recognized and excluded or modeled. The fit should be made to a period when the well was producing under stable conditions with a consistent operating strategy. The decline exponent and initial decline should be consistent with the flow regime and with analog wells: a b value of 2.5 fitted to six months of data is almost certainly wrong.
Engineers increasingly use rate-transient analysis alongside decline curves. By using the flowing pressure as well as the rate, it identifies flow regimes, estimates reservoir and fracture properties and gives a physically based forecast. It is covered with well testing in PET-360. Decline curves remain the everyday tool because they need only production data, which every well has.
# Arps decline curve fit to 24 months of a horizontal well, with a terminal decline and the EUR
import math
SI = False
if SI:   # monthly average oil rate, m3/d, Tamarack 03-22 (Cardium)
    q = [39.9, 36.9, 34.0, 30.1, 27.7, 26.6, 24.7, 24.3, 22.7, 21.3, 20.1, 19.3, 17.7, 17.3, 16.2, 16.4, 14.7, 15.1, 13.7, 13.8, 13.0, 12.6, 12.6, 11.4]
    qlim, dmin, u, vol = 1.5, 0.08, "m3/d", "m3"
else:    # monthly average oil rate, STB/d, Tamarack 3-22H (Bakken)
    q = [849, 795, 686, 599, 587, 540, 469, 449, 412, 394, 382, 350, 348, 316, 305, 308, 287, 277, 271, 259, 249, 234, 240, 238]
    qlim, dmin, u, vol = 15.0, 0.06, "STB/d", "STB"
t = [m - 0.5 for m in range(1, len(q) + 1)]                     # months
def arps(qi, D, b, tt):                                         # D: nominal monthly decline at time zero
    if b == 0: return qi * math.exp(-D * tt)
    return qi / (1 + b * D * tt) ** (1 / b)
best = None
for ib in range(0, 31):                                         # grid search on b and D; qi solved by least squares in log space
    b = ib * 0.05
    for iD in range(1, 81):
        D = iD * 0.005
        lq = [math.log(x) - math.log(arps(1.0, D, b, tt)) for x, tt in zip(q, t)]
        lqi = sum(lq) / len(lq)
        err = sum((v - lqi) ** 2 for v in lq)
        if best is None or err < best[0]: best = (err, math.exp(lqi), D, b)
err, qi, D, b = best
eff = 1 - (1 + b * D * 12) ** (-1 / b) if b else 1 - math.exp(-12 * D)
print(f"best fit: qi = {qi:.1f} {u}, initial nominal decline D = {D:.3f} per month, b = {b:.2f} (first-year effective decline {eff:.0%})")
dlim = -math.log(1 - dmin) / 12                                  # terminal nominal monthly decline from an effective annual value
cum, tt, rate, switched = 0.0, 0.0, qi, None
while rate > qlim and tt < 600:
    Dnow = D / (1 + b * D * tt)                                  # instantaneous nominal decline on the hyperbola
    if switched is None and Dnow <= dlim: switched = (tt, rate)
    if switched: rate = switched[1] * math.exp(-dlim * (tt - switched[0]))
    else: rate = arps(qi, D, b, tt)
    cum += rate * 30.4; tt += 1
print(f"switch to {dmin:.0%} per year exponential decline after {switched[0]/12:.1f} years at {switched[1]:.1f} {u}")
print(f"economic limit {qlim} {u} reached after {tt/12:.1f} years; EUR = {cum:,.0f} {vol}")
pure = sum(arps(qi, D, b, m) * 30.4 for m in range(int(tt)))
print(f"for comparison, the pure hyperbola over the same life gives {pure:,.0f} {vol} ({pure/cum - 1:+.0%})")
print(f"to date (24 months): {sum(x * 30.4 for x in q):,.0f} {vol}")best fit: qi = 946.7 STB/d, initial nominal decline D = 0.160 per month, b = 1.20 (first-year effective decline 63%) switch to 6% per year exponential decline after 13.1 years at 54.2 STB/d economic limit 15.0 STB/d reached after 34.0 years; EUR = 942,437 STB for comparison, the pure hyperbola over the same life gives 979,375 STB (+4%) to date (24 months): 299,258 STB
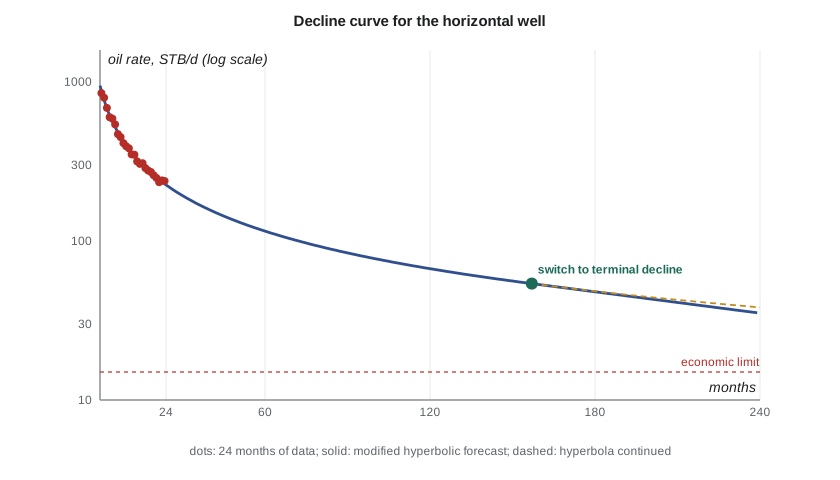
The fit to the 3-22H well's 24 months gives an initial rate of about 950 STB/d, an initial nominal decline of 0.16 per month and b = 1.2, a first-year effective decline of about 63 percent. Switching to a 6 percent per year terminal decline after about 13 years, the well reaches its 15 STB/d economic limit after about 34 years, with an estimated ultimate recovery of about 940,000 STB, of which about 300,000 STB has been produced. The pure hyperbola would add about 4 percent over the same life and keep growing beyond it, which is exactly why the terminal decline is required.
Putting the study together
A reservoir study is not a collection of separate calculations; it is an argument in which each method checks the others. Lena asks Ethan to lay out the evidence the way the review committee will want to see it: what is in place, how it is connected, what drives it, how the wells perform, what the base case recovers, and what an investment could add.
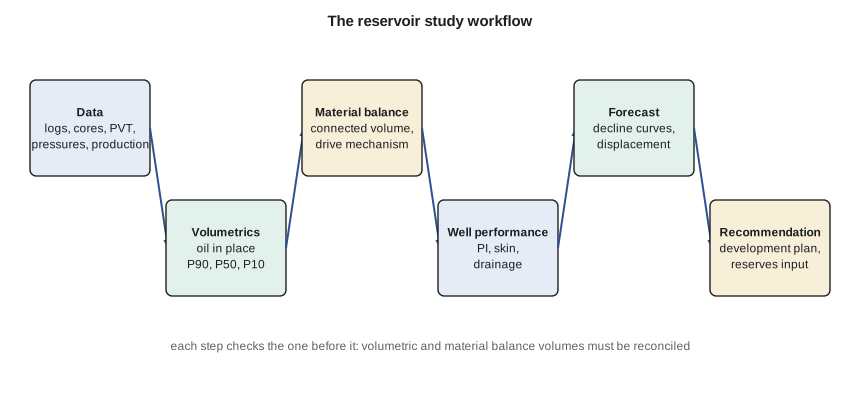
The volumetric estimate for the study unit gives P90 13.2, P50 15.2 and P10 17.3 MMSTB of oil in place (lesson 2). The material balance gives 14.7 MMSTB with no aquifer (lesson 5), consistent with the volumetrics, so the oil connected to the wells is close to the mapped oil, although that connected volume may still be growing. The unit is strongly undersaturated, with about 1,300 psi above its bubble point (lessons 3 and 6). The two wells in the unit, each with an estimated ultimate recovery near 940,000 STB, would recover about 1.9 MMSTB, or about 12 percent of the oil in place. The question that drives the unit's value is therefore not how much oil is there but how many wells are needed to reach more of it.
The recommendation
Ethan's draft recommendation has three parts. First, study additional wells per unit with a simulation model calibrated to the two existing wells, because the spacing decision controls how much of the 15 MMSTB the unit recovers. Second, monitor the producing gas-oil ratio closely as the average pressure approaches the 2,600 psia bubble point, because the wells' behavior will change when free gas forms in the rock. Third, book the decline-based reserves for the existing wells with the 6 percent terminal decline, and keep watching basin waterflood and gas-injection pilots as possible future projects. Lena adds a fourth: install permanent downhole gauges in the next wells, because better pressure data would make every method in this study more reliable.
The study will be reviewed, challenged and revised. That is how reservoir engineering works: every estimate is a hypothesis to be tested by the next year of data. The methods in this course, volumetrics, material balance, flow equations, displacement and decline, are the tools for that testing, and they recur in every later petroleum course: well testing, production engineering, simulation, enhanced recovery, natural gas engineering and reserves evaluation.
Professional responsibility
Reserves and resource estimates are used by investors, lenders and governments, so the work carries professional obligations. Engineers who certify reserves often hold a professional engineer license, and the SEC requires disclosure of the qualifications of the people who prepared or audited reported reserves. The SPE also publishes standards for the estimating and auditing of reserves information. Engineers must document their methods and assumptions, state uncertainty honestly and not let commercial pressure change a technical estimate.
Worked problem
Exponential decline and remaining reserves
A well produces 200 STB/d and declines exponentially at an effective 15 percent per year. Its economic limit is 10 STB/d. Find the nominal decline and the remaining reserves.
Show solution
- Nominal decline D = −ln(1 − 0.15) = 0.1625 per year.
- Remaining reserves = (q − qlim)/D = (200 − 10) STB/d × 365 d/yr / 0.1625 per year.
- = 190 × 365/0.1625 = 69,350/0.1625 = 426,800 STB.
Answer: D ≈ 0.163 per year; about 427,000 STB remaining.
Common mistakes
MistakeExtending a hyperbola with b above one for decades.
InsteadApply a terminal exponential decline; with b > 1 the hyperbola's cumulative has no limit.
MistakeMixing nominal and effective decline rates.
InsteadConvert with De = 1 − e^(−D) for exponential decline, and state which you use.
MistakeFitting through shut-ins and operational changes.
InsteadFit stable periods and account for operational events separately.
MistakeTreating a decline exponent as a free fitting parameter only.
InsteadCheck it against the flow regime and analog wells.
MistakeReporting one number from the study.
InsteadPresent volumes and recoveries as ranges, with the methods reconciled.
Summary and key terms
- Arps decline: q = qi/(1 + b Di t)^(1/b); b = 0 exponential, b = 1 harmonic, between them hyperbolic.
- Exponential decline is physically based in boundary-dominated flow at constant flowing pressure.
- Fractured horizontal wells often fit b above one because of long transient linear flow.
- A modified hyperbolic decline switches to a terminal exponential decline to avoid overestimating recovery.
- Nominal and effective declines must be converted correctly.
- A reservoir study reconciles volumetrics, material balance, well performance and decline into ranges and a recommendation.
- Reserves work carries professional and regulatory obligations.
- Arps decline
- An empirical family of rate-time curves defined by the initial rate, initial decline and decline exponent.
- Decline exponent (b)
- The parameter describing how the decline rate changes with rate.
- Nominal decline
- The instantaneous fractional rate of decline per unit time.
- Effective decline
- The fractional drop in rate over a stated period.
- Modified hyperbolic decline
- A hyperbolic decline that switches to exponential at a terminal decline rate.
- Estimated ultimate recovery (EUR)
- Cumulative production expected from a well over its life to the economic limit.
- Economic limit
- The rate below which a well no longer covers its operating costs.
Practice problems
Work each problem on paper first, then reveal the answer to check.
An exponential decline has a nominal rate of 0.30 per year. What is the effective annual decline?
Show answer
1 − e^(−0.30) = 0.26, or 26 percent.
Why does a hyperbola with b = 1.5 give an unrealistic EUR if extended indefinitely?
Show answer
With b > 1 the cumulative grows without bound as time increases.
What flow regime gives a theoretical b of 2?
Show answer
Transient linear flow toward the fractures.
Volumetric P50 is 10 units and material balance gives 6. Name two follow-up checks.
Show answer
Check connectivity (faults, pinch-outs) and the mapped area and saturations; also check the average pressure data.
Lesson quiz · 5 questions
Score 60% or more to complete this lesson.
Create a free account to save your progress, take quizzes and earn a certificate.