
MEC-250 · Lesson 4 of 12 · 26 min
Tensile testing and mechanical properties
Before blaming the design or the loads, Jonah wanted to know whether the broken shaft had the strength it was supposed to have. The drawing called for a chromium–molybdenum steel, quenched and tempered to a hardness of 28 to 34 on the Rockwell C scale. Kestrel keeps a few shafts from every heat lot, so Rosa machined tensile specimens from a sister shaft made from the same bar and heat treated in the same furnace load, and tested them on the lab's universal testing machine. This lesson explains what the test measures, how to turn its raw load and extension readings into properties, and how those properties are used in design.
Stress and strain
Loads and deformations depend on the size of the part, so we normalize them. Engineering stress is the load divided by the original cross-sectional area, and engineering strain is the change in length divided by the original length:
Stress is in pascals or megapascals (1 MPa = 1 N/mm²) in SI, and in pounds per square inch or kips per square inch in US customary units (1 ksi = 1000 psi = 6.895 MPa). Strain is dimensionless, often quoted as a percentage. Tensile loads give positive stress and strain; compressive loads give negative values. Shear stress, \(\tau = F/A_0\) with the force parallel to the area, produces shear strain \(\gamma\), the tangent of the angle of distortion.
Elastic behavior
At low stresses most metals deform elastically: the strain is proportional to the stress and disappears completely when the load is removed. The constant of proportionality is Young's modulus, or the modulus of elasticity:
As Lesson 1 showed, the modulus reflects the stiffness of interatomic bonds. It depends very little on alloying, heat treatment or cold work, which surprises many students: a soft annealed steel and a hard quenched one have almost the same modulus, about 200 to 210 GPa. If a steel part deflects too much, changing the grade or heat treatment will not help; only changing the geometry or the material class will. Aluminum alloys have a modulus of about 70 GPa, titanium alloys about 110 GPa, and most polymers between 0.2 and 4 GPa.
A bar stretched elastically in one direction also contracts sideways. The ratio of lateral to axial strain is Poisson's ratio, \(\nu = -\varepsilon_{\text{lateral}}/\varepsilon_{\text{axial}}\). For metals it is typically 0.26 to 0.35; for rubber it approaches 0.5, meaning the volume hardly changes. For an isotropic material, the shear modulus is related to the other two constants by \(G = E/[2(1 + \nu)]\), so steel with \(E = 205\ \text{GPa}\) and \(\nu = 0.29\) has \(G = 79.5\ \text{GPa}\).
Worked problem
Elastic stretch of a test bar
A steel specimen 0.500 in in diameter with a 2.00 in gauge length carries 9,000 lbf. Take \(E = 29.7 \times 10^6\ \text{psi}\) and \(\nu = 0.29\). Find the stress, the extension of the gauge length and the change in diameter.
Show solution
- \(A_0 = \pi(0.500)^2/4 = 0.1963\ \text{in}^2\), so \(\sigma = 9000/0.1963 = 45\,800\ \text{psi} = 45.8\ \text{ksi}\).
- \(\varepsilon = \sigma/E = 45\,800/(29.7 \times 10^6) = 1.54 \times 10^{-3}\), so \(\Delta L = (1.54 \times 10^{-3})(2.00) = 0.0031\ \text{in}\).
- Lateral strain \(= -0.29(1.54 \times 10^{-3}) = -4.47 \times 10^{-4}\), so \(\Delta d = -4.47 \times 10^{-4} \times 0.500 = -0.00022\ \text{in}\).
Answer: Elastic deformations of steel are tiny: less than a tenth of a millimeter over the gauge length at a third of the yield strength. This is why tensile machines measure strain with a clip-on extensometer rather than from the movement of the crosshead, which includes the stretch of the grips and the machine frame.
The tensile test
In a tensile test, a carefully machined specimen with a reduced central section is pulled at a slow, controlled rate while the load and the extension of a marked gauge length are recorded. Standard methods, such as ASTM E8 and ISO 6892-1, specify the specimen geometry, the testing rate and how results are calculated, so that laboratories can compare their results. The raw data are converted to an engineering stress–strain curve, which for a ductile metal has four regions.
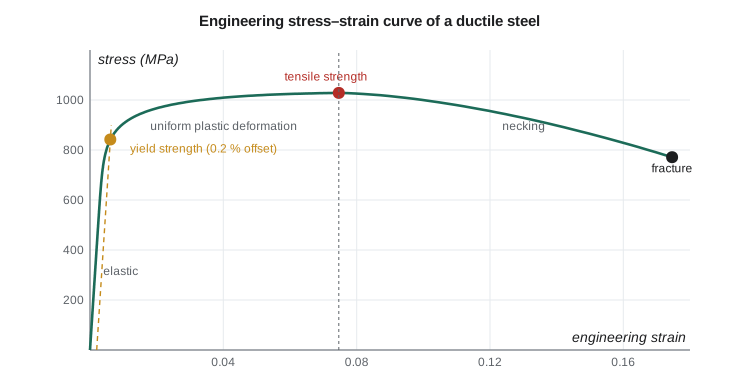
First comes the straight elastic region. Then plastic deformation begins: the curve bends over, and unloading would leave a permanent set. For most metals the transition is gradual, so the yield strength is defined by convention as the stress at which a line parallel to the elastic line, offset by a strain of 0.002 (0.2 percent), meets the curve. Some low-carbon steels show a distinct yield point instead, with a sharp drop in load and a short plateau while bands of deformation spread along the specimen.
Beyond yield, the metal strain hardens: it becomes stronger as it deforms, and the stress rises, although more slowly. The specimen stretches uniformly along its gauge length. Eventually the increase in strength from strain hardening can no longer compensate for the decrease in cross-sectional area, and a neck forms at the weakest location. The maximum on the engineering curve is the tensile strength or ultimate tensile strength (UTS). After necking the load falls as deformation concentrates in the neck, until the specimen fractures, usually in a cup-and-cone shape for ductile metals.
Ductility, resilience and toughness
Ductility is the amount of plastic deformation before fracture. It is reported as percent elongation, \(\%\text{EL} = 100(L_f - L_0)/L_0\), measured by fitting the broken halves together, and as percent reduction in area, \(\%\text{RA} = 100(A_0 - A_f)/A_0\), measured at the neck. Elongation depends on the gauge length, because the neck contributes a fixed amount of extension, so the gauge length must always be stated. Ductility matters for forming, for the ability of a part to yield locally at a stress concentration instead of cracking, and as a warning: a ductile part deforms visibly before it breaks.
Resilience is the ability to absorb energy elastically and release it on unloading, the property that matters in springs. The modulus of resilience is the area under the elastic part of the curve, \(U_r = \sigma_y^2/(2E)\). High-strength steels with yield strengths of 1500 MPa or more make excellent springs. Toughness, in the tensile test sense, is the total energy absorbed per unit volume before fracture, the whole area under the curve. A tough material combines strength and ductility. Lesson 6 introduces fracture toughness, a more useful measure for parts that may contain cracks.
True stress and true strain
Engineering stress uses the original area, so after necking it understates the stress in the neck. True stress uses the instantaneous area, \(\sigma_T = F/A_i\), and true strain integrates the small increments of strain, \(\varepsilon_T = \ln(L_i/L_0)\). Up to the onset of necking, when the volume is constant and deformation is uniform, the two sets are related simply:
Over the plastic range before necking, many metals follow the Hollomon relation \(\sigma_T = K\varepsilon_T^{\,n}\), where \(K\) is the strength coefficient and \(n\) the strain-hardening exponent. For annealed steels and copper \(n\) is 0.2 to 0.5; for quenched and tempered steels it is 0.05 to 0.15. A useful result, the Considère criterion, shows that necking begins when the true strain equals \(n\). Metals with large \(n\) stretch uniformly further and are easier to form into deep shapes.
Worked problem
True stress at maximum load
Rosa's specimen reached a maximum load of 126.2 kN at an engineering strain of 0.075. The original area was 122.7 mm². Find the engineering and true stresses and the true strain at that point.
Show solution
- Engineering stress: \(\sigma = 126\,200/122.7 = 1028\ \text{MPa}\). This is the tensile strength.
- \[\sigma_T = 1028(1 + 0.075) = 1105\ \text{MPa} \qquad \varepsilon_T = \ln(1.075) = 0.0723\]
Answer: The true strain at necking, 0.072, is close to the strain-hardening exponent of this steel, about 0.075, as the Considère criterion predicts.
Reducing Rosa's test data
Modern testing machines produce thousands of load–extension pairs, and the properties are calculated by software. It is worth knowing what the software does, because it can be fooled by a slipping extensometer or a poorly aligned specimen. The program below builds a curve with the same shape as Rosa's data and reduces it: a least-squares fit for the modulus, the 0.2 percent offset intersection for yield, the maximum for tensile strength, numerical integration for toughness, and a log–log fit of true stress against plastic true strain for \(n\).
# Reduce a tensile test: modulus, 0.2 % offset yield, tensile strength, elongation, toughness
import math

E_true, K, n = 205000.0, 1350.0, 0.075       # MPa; plastic law sigma_T = K * eps_p^n (illustrative)
d0, L0 = 12.5, 50.0                           # specimen diameter and gauge length, mm
A0 = math.pi * d0 ** 2 / 4

# Build a synthetic engineering curve: elastic line, then strain hardening up to necking,
# then a falling load until fracture (a simple stand-in for real machine data).
strain, stress = [], []
for i in range(0, 700):
    s = i * 2.5                                   # engineering stress steps, MPa
    eT_p = (s / K) ** (1 / n) if s > 0 else 0.0   # plastic true strain (approximation, small strains)
    e = s / E_true + eT_p
    if e > 0.075:                                 # stop near the necking strain
        break
    strain.append(e); stress.append(s / (1 + e))  # engineering stress = true stress / (1 + e)
emax = strain[-1]; smax = stress[-1]
for j in range(1, 41):                            # post-necking: load falls 25 % by fracture
    strain.append(emax + j * 0.0025); stress.append(smax * (1 - 0.25 * (j / 40) ** 1.6))

# 1. Modulus from the first points (least squares through the origin)
pts = [(e, s) for e, s in zip(strain, stress) if s < 400]
E = sum(e * s for e, s in pts) / sum(e * e for e, s in pts)

# 2. 0.2 % offset yield: first point where the curve falls below the offset line
ys = None
for e, s in zip(strain, stress):
    if s < E * (e - 0.002):
        ys = s; break

uts = max(stress)
e_u = strain[stress.index(uts)]
e_f = strain[-1] - stress[-1] / E                 # elastic recovery removed after fracture
tough = sum((strain[i + 1] - strain[i]) * (stress[i + 1] + stress[i]) / 2 for i in range(len(strain) - 1))
Ur = ys ** 2 / (2 * E)

print(f"Young's modulus      E   = {E / 1000:7.1f} GPa")
print(f"0.2 % offset yield   sy  = {ys:7.0f} MPa ({ys / 6.895:6.1f} ksi)")
print(f"tensile strength     UTS = {uts:7.0f} MPa ({uts / 6.895:6.1f} ksi)")
print(f"uniform elongation       = {100 * e_u:7.1f} %")
print(f"elongation at break      = {100 * e_f:7.1f} % in {L0:.0f} mm")
print(f"modulus of resilience    = {Ur:7.2f} MJ/m3")
print(f"toughness (area)         = {tough:7.0f} MJ/m3")
print(f"maximum load             = {uts * A0 / 1000:7.1f} kN")

# 3. True stress and plastic true strain up to necking; strain-hardening exponent from a log-log fit
xs, zs = [], []
for e, s in zip(strain, stress):
    if 0.01 < e <= e_u:
        sT, eT = s * (1 + e), math.log(1 + e)
        xs.append(math.log(eT - sT / E)); zs.append(math.log(sT))   # plastic part of true strain
m = len(xs); mx, mz = sum(xs) / m, sum(zs) / m
slope = sum((x - mx) * (z - mz) for x, z in zip(xs, zs)) / sum((x - mx) ** 2 for x in xs)
print(f"\nfit of true stress vs true strain: n = {slope:.3f}, K = {math.exp(mz - slope * mx):.0f} MPa")
print(f"Considere check: necking expected at true strain = n; measured {math.log(1 + e_u):.3f}")

# 4. Hardness estimate of tensile strength for steels: UTS (MPa) ~ 3.45 x HB
for HB in (180, 240, 286, 340):
print(f"HB {HB}: estimated UTS about {3.45 * HB:5.0f} MPa")Young's modulus E = 204.7 GPa 0.2 % offset yield sy = 842 MPa ( 122.2 ksi) tensile strength UTS = 1028 MPa ( 149.1 ksi) uniform elongation = 7.5 % elongation at break = 17.1 % in 50 mm modulus of resilience = 1.73 MJ/m3 toughness (area) = 164 MJ/m3 maximum load = 126.2 kN fit of true stress vs true strain: n = 0.076, K = 1356 MPa Considere check: necking expected at true strain = n; measured 0.072 HB 180: estimated UTS about 621 MPa HB 240: estimated UTS about 828 MPa HB 286: estimated UTS about 987 MPa HB 340: estimated UTS about 1173 MPa
The results matched the drawing. A yield strength of about 840 MPa (122 ksi) and a tensile strength of about 1030 MPa (149 ksi), with 17 percent elongation, are typical of this steel tempered to around 31 HRC. Rosa's hardness readings on the broken shaft itself were 30 to 32 HRC. The material was what it was supposed to be. Jonah crossed one possible cause off the list and moved the investigation toward the loading and the geometry.
Hardness
Hardness is resistance to localized plastic deformation, measured by pressing an indenter into the surface. It is quick, cheap and nearly non-destructive, so it is the most common test in production. In the Brinell test, a hard ball 10 mm in diameter is pressed in with a load of up to 3000 kgf and the diameter of the impression is measured; the Brinell hardness number (HB) is the load divided by the curved area of the impression. In the Rockwell test, the depth of penetration under a major load, after a minor preload, is read directly from a dial or display. Several scales exist: Rockwell C, with a diamond cone and 150 kgf, is used for hardened steels, and Rockwell B, with a ball, for softer metals. Vickers and Knoop tests use small pyramidal diamonds and are used for thin layers, small parts and individual microstructural features, such as measuring the hardness profile of a carburized case.
| Condition of a 0.4 % C alloy steel | Approx. HRC | Approx. HB | Approx. UTS (MPa) |
|---|---|---|---|
| Annealed | — | 200 | 690 |
| Quenched and tempered, high temperature | 22 | 235 | 810 |
| Quenched and tempered (Kestrel shaft) | 31 | 295 | 1020 |
| Quenched and tempered, low temperature | 45 | 420 | 1450 |
| As-quenched martensite | 55 | 560 | — |
For steels, hardness and tensile strength are roughly proportional: the tensile strength in megapascals is about 3.45 times the Brinell hardness (or 500 times HB in psi). The relation is empirical and should not be used for other materials or for acceptance, but it is extremely useful for a quick check, as Rosa did on the broken shaft. Hardness also correlates with wear resistance, which is why gear teeth and bearing races are hardened.
Variability and design
Measured properties scatter. Specimens from the same bar may differ by a few percent in strength and by much more in elongation. Material specifications therefore give minimum values, and handbook data are often typical rather than guaranteed. Designers handle variability and uncertainty in loads and analysis with a design factor or factor of safety: the allowable stress is the yield strength divided by a factor, typically 1.2 to 4 depending on the consequences of failure, the quality of the load data and the applicable code. Pressure vessel, crane and structural codes specify these factors; for machine parts like Kestrel's shafts, the factor is set by company practice and validated by testing.
Common mistakes
MistakeExpecting heat treatment to change the stiffness of a steel part.
InsteadHeat treatment changes strength and hardness, but the modulus hardly changes.
MistakeMeasuring strain from crosshead movement in the elastic range.
InsteadUse an extensometer; crosshead movement includes machine and grip compliance.
MistakeQuoting percent elongation without the gauge length.
InsteadElongation depends on gauge length because the neck adds a fixed extension.
MistakeUsing engineering stress to describe the stress in the neck.
InsteadAfter necking the true stress in the neck is much higher than the engineering stress.
MistakeUsing the hardness–strength relation for aluminum or cast iron.
InsteadThe 3.45 × HB rule is an approximation for steels only.
Summary and key terms
- Engineering stress and strain are load and extension normalized by original area and length.
- Elastic behavior follows σ = Eε; E, G and ν are related by G = E/[2(1 + ν)].
- The modulus depends on bonding and changes little with heat treatment.
- Yield strength is usually defined by the 0.2 % offset; the tensile strength is the maximum engineering stress.
- Ductility is reported as % elongation and % reduction in area; resilience is σ_y²/2E; toughness is the total area.
- True stress and strain follow σ_T = σ(1 + ε) and ε_T = ln(1 + ε) before necking; necking starts at ε_T = n.
- Hardness tests are fast; for steels, UTS in MPa is roughly 3.45 × HB.
- Engineering stress
- Load divided by original cross-sectional area.
- Young's modulus
- The ratio of stress to strain in the elastic region.
- Poisson's ratio
- The negative ratio of lateral to axial strain under uniaxial load.
- Yield strength
- The stress at which noticeable plastic deformation begins, usually by the 0.2 % offset.
- Tensile strength
- The maximum engineering stress in a tensile test.
- Ductility
- The amount of plastic deformation before fracture.
- Strain hardening
- The increase in strength of a metal as it is plastically deformed.
- Hardness
- Resistance to localized plastic deformation by an indenter.
- Design factor
- The ratio between a material strength and the allowable stress in design.
Practice problems
Work each problem on paper first, then reveal the answer to check.
A bar of aluminum alloy (E = 70 GPa) 10 mm in diameter carries 8 kN. Find the stress and strain.
Show answer
σ = 102 MPa; ε = 1.46 × 10⁻³.
Find G for a titanium alloy with E = 114 GPa and ν = 0.34.
Show answer
About 42.5 GPa.
Compare the modulus of resilience of the Kestrel steel (σ_y = 842 MPa) with a spring steel (σ_y = 1600 MPa), both with E = 205 GPa.
Show answer
1.73 and 6.24 MJ/m³.
A specimen 12.5 mm in diameter necks to 8.0 mm. What is the percent reduction in area?
Show answer
59 %.
At an engineering stress of 600 MPa and strain of 0.12, what are the true stress and true strain?
Show answer
672 MPa and 0.113.
In the program, lower the strength coefficient K from 1350 to 1200 MPa. What happens to the yield and tensile strengths?
Show answer
Both fall by about 11 %: yield to about 750 MPa and tensile strength to about 915 MPa.
Lesson quiz · 5 questions
Score 60% or more to complete this lesson.
Create a free account to save your progress, take quizzes and earn a certificate.