
MBA-501 · Lesson 12 of 12 · 21 min
Capstone: a financial diagnosis of a company
The final lesson brings the course together in a single exercise: diagnosing the financial health and performance of a company from its statements, explaining what is driving the results, and recommending what management should do. The cohort works in teams on Cedarline Outdoor, an invented maker and retailer of outdoor clothing and equipment that sells through its own stores, online and through sporting goods chains. Cedarline's board has asked for an independent view before deciding whether to approve an ambitious expansion plan. The lesson walks through the analysis step by step, using every tool from Lessons 1 to 11.
The brief
Cedarline is a private company headquartered in Chicago, owned by its founding family and a private equity investor, and reports under US GAAP because it has bonds held by institutional investors. Revenue has grown from 312 million to 468 million dollars over four years. Management wants to open 18 new stores over three years and build a second distribution center, at a total cost of about 95 million dollars, financed with a new term loan. The private equity investor is uneasy: profits have grown, but the company has needed more borrowing every year. Dr. Achterberg gives the teams five years of statements and one question: is Cedarline healthy enough to take on the plan, and what should the board require before it says yes?
Step 1: understand the business
Before calculating anything, the teams read the MD&A and notes. Cedarline earns about 45 % of revenue in its own stores, 25 % online and 30 % wholesale to sporting goods chains. Its products are designed in-house and made by contract manufacturers in Asia, with long lead times: orders for winter products are placed in the spring. The business is seasonal, with half of annual sales between October and January. Its year ends on 31 March, when inventory should be near its lowest. Store leases are on the balance sheet as right-of-use assets and lease liabilities. Wholesale customers have 60-day terms, and the two largest chains account for 18 % of revenue.
This context shapes the analysis. A brand with long supply lead times must commit to inventory long before it knows demand, so inventory risk is central. Wholesale customers on 60-day terms make receivables important. And leases mean that debt ratios must include lease liabilities.
Step 2: trends in the income statement
The first table summarizes five years of results. Revenue grew at about 10.7 % a year. Gross margin slipped from 54.0 % to 49.8 %, as discounting increased and the wholesale share grew. Operating expenses rose with store openings and online marketing. Operating margin fell from 11.2 % to 8.5 %, yet operating profit still rose in dollars because revenue grew so fast.
| Fiscal year | 2022 | 2023 | 2024 | 2025 | 2026 |
|---|---|---|---|---|---|
| Revenue | 312 | 348 | 389 | 427 | 468 |
| Gross margin | 54.0 % | 53.1 % | 51.9 % | 50.6 % | 49.8 % |
| Operating profit | 34.9 | 35.8 | 36.6 | 37.1 | 39.8 |
| Operating margin | 11.2 % | 10.3 % | 9.4 % | 8.7 % | 8.5 % |
| Net income | 21.6 | 21.4 | 20.9 | 20.3 | 21.1 |
| Cash from operations | 30.2 | 24.8 | 18.6 | 14.9 | 12.4 |
| Capital expenditure | 14.0 | 16.5 | 18.2 | 19.8 | 21.0 |
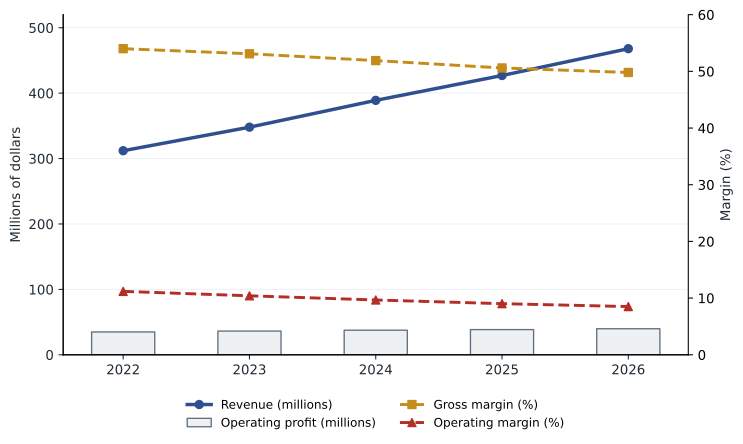
Net income has been flat for five years while revenue grew by half. The rest of the operating profit growth went to higher interest costs as debt rose. That pattern, growth that does not raise profit, is the first warning sign.
Step 3: from profit to cash
The second warning sign is in the cash flow statement. Operating cash flow fell from 30.2 million to 12.4 million dollars while net income was steady, and capital spending rose. Free cash flow, operating cash flow minus capital spending, went from positive 16 million to negative 9 million. Cedarline has funded the gap, plus dividends to its owners, by borrowing.
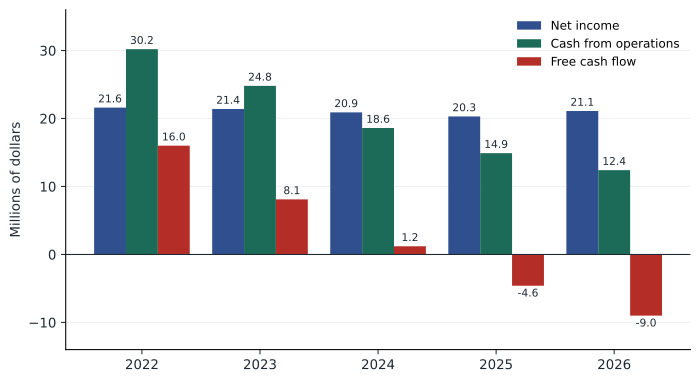
The indirect method shows why. Inventory rose from 58 million to 128 million dollars, more than doubling while sales rose 50 %, and receivables rose from 26 million to 52 million. The teams calculated the cash conversion cycle and the accruals ratio to measure the problem.
# Cedarline Outdoor: diagnostic ratios from five years of data (millions of dollars)
years = [2022, 2023, 2024, 2025, 2026]
revenue = [312, 348, 389, 427, 468]
gross_margin = [0.540, 0.531, 0.519, 0.506, 0.498]
net_income = [21.6, 21.4, 20.9, 20.3, 21.1]
cfo = [30.2, 24.8, 18.6, 14.9, 12.4]
inventory = [58, 71, 89, 108, 128]
receivables = [26, 31, 38, 45, 52]
payables = [31, 33, 36, 38, 40]
total_assets = [262, 296, 338, 381, 424]
for i, y in enumerate(years):
    cogs = revenue[i] * (1 - gross_margin[i])
    dio = 365 * inventory[i] / cogs
    dso = 365 * receivables[i] / revenue[i]
    dpo = 365 * payables[i] / cogs
    ccc = dio + dso - dpo
    acc = (net_income[i] - cfo[i]) / total_assets[i]
print(f"{y}: DIO {dio:5.0f} DSO {dso:4.0f} DPO {dpo:4.0f} cycle {ccc:5.0f} days accruals {acc:6.1%}")2022: DIO 148 DSO 30 DPO 79 cycle 99 days accruals -3.3% 2023: DIO 159 DSO 33 DPO 74 cycle 117 days accruals -1.1% 2024: DIO 174 DSO 36 DPO 70 cycle 139 days accruals 0.7% 2025: DIO 187 DSO 38 DPO 66 cycle 160 days accruals 1.4% 2026: DIO 199 DSO 41 DPO 62 cycle 177 days accruals 2.1%
Days inventory outstanding rose from about 147 to about 199 days. Days sales outstanding rose from 30 to 41, as wholesale grew and the largest customers paid later. The cash conversion cycle lengthened by more than two months, tying up roughly 85 million dollars of extra operating working capital, close to the total increase in debt. The accruals ratio climbed steadily: profit was increasingly made of inventory and receivables rather than cash.
Step 4: DuPont and ROIC
The teams then decomposed returns. Return on equity fell from about 15 % to 12 %. Net margin fell from 6.9 % to 4.5 % and asset turnover fell slightly, while the equity multiplier rose as debt grew. Return on invested capital, with lease liabilities included in invested capital, fell from about 12 % to 8 %, below the 9 % cost of capital the private equity investor uses. Economic profit had turned negative. Growth was now destroying value: each new store and each extra season of inventory earned less than the capital it consumed.
# Cedarline: ROIC versus cost of capital (millions of dollars)
tax_rate, wacc = 0.26, 0.09
ebit = {2022: 34.9, 2026: 39.8}
invested_capital = {2022: 214.0, 2026: 368.0}       # operating working capital + PP&E + right-of-use assets
for y in (2022, 2026):
    nopat = ebit[y] * (1 - tax_rate)
    roic = nopat / invested_capital[y]
    ep = (roic - wacc) * invested_capital[y]
print(f"{y}: NOPAT {nopat:5.1f} ROIC {roic:5.1%} economic profit {ep:6.1f}")2022: NOPAT 25.8 ROIC 12.1% economic profit 6.6 2026: NOPAT 29.5 ROIC 8.0% economic profit -3.7
Step 5: liquidity, leverage and covenants
Net debt including leases rose from 1.6 to 3.4 times EBITDA. Interest coverage fell from 9 times to 4.2 times. The bond indenture limits net debt to EBITDA to 3.75 times. The 95 million dollar expansion, if financed with debt and before any new stores contributed, would push leverage above 4.5 times, breaching the covenant. Liquidity looked adequate on a current ratio of 2.4, but the quick ratio of 0.7 showed how much of the current assets was inventory.
Step 6: costs, products and channels
The financial statements explain what happened; managerial analysis explains why. Grace's team asked management for channel profitability. Using an activity-based approach to distribution and customer service costs, the team found that wholesale gross margin of 38 % fell to an operating contribution of about 9 % after chargebacks, returns, co-operative advertising and the cost of 60-day terms. Online sales had a high gross margin but carried free shipping and returns, leaving a contribution of about 14 %. The company's own stores earned the highest contribution, about 21 %, but new stores took three years to reach mature sales.
Daniel's team looked at inventory by product. About 22 % of inventory was more than a year old, mostly in colors and sizes that had not sold. The company had extended its range from 900 to 1,600 styles in four years, and the long tail of styles sold slowly and needed heavy markdowns, which explained much of the gross margin decline. The cost of complexity, in design, sampling, minimum order quantities and markdowns, never appeared on any single line of the income statement.
Step 7: the recommendation
Each team presented a recommendation in the format a board expects: a short answer, the evidence, the options and the conditions. The strongest presentation, from Hana and Owen's team, recommended that the board not approve the full plan as proposed and instead approve a revised plan in two stages.
- Stage 1 (twelve months): free cash from working capital before expanding. Cut the style count by a third, clear aged inventory, reduce days inventory outstanding by 60 days and days sales outstanding by 7, which together release about 50 million dollars. Renegotiate wholesale terms or move part of the wholesale volume to the higher-contribution channels.
- Stage 2: approve new stores in tranches of six, financed partly from the released cash, with each tranche conditional on the previous one meeting sales and contribution targets and on leverage staying below 3.0 times EBITDA.
- Controls and reporting: monthly reporting to the board of the cash conversion cycle, inventory aging, channel contribution and ROIC against the cost of capital, alongside the usual profit figures.
- Incentives: change the management bonus from revenue and net income growth to economic profit and operating cash flow, so that growth that consumes capital is no longer rewarded.
The team's sensitivity analysis showed that the revised plan would raise ROIC back above the cost of capital within two years if the working capital targets were met, and would keep leverage within the covenant even if new stores opened 15 % below plan. Dr. Achterberg's feedback was that the recommendation worked because it tied every number to an operating cause, gave the board conditions it could monitor, and changed the incentives that had created the problem.
What the capstone teaches
The Cedarline case is typical. The company was not failing; it was profitable and growing. But its growth was consuming capital faster than it generated returns, and its reported earnings looked steadier than its economics. Each tool in the course exposed part of the story: the balance sheet showed inventory and debt building, the cash flow statement showed profit not turning into cash, ratios and DuPont analysis showed falling margins and rising leverage, ROIC showed value destruction, and activity-based channel and product analysis showed the operating causes. No single number told the story; the combination did.
For the rest of the MBA, these tools become the common language. Corporate finance will discount the free cash flows you have learned to calculate. Strategy will ask why ROIC differs between firms. Operations will work on the cash conversion cycle. Marketing will ask what the customer will pay. Leadership courses will ask how incentives shape behavior. Accounting is not one subject among many; it is how all the others are measured.
Worked problem
Writing the board summary
Draft the opening three sentences of the team's report to Cedarline's board.
Show solution
- Lead with the answer: the board should not approve the expansion as proposed.
- Give the core evidence in one sentence: growth has been funded by debt because working capital has absorbed the cash that profits should have produced, and ROIC has fallen below the cost of capital.
- State the recommendation: approve a staged plan that first releases about 50 million dollars from inventory and receivables, then opens stores in tranches subject to performance and leverage conditions.
Answer: Boards read the first paragraph closely and skim the rest. A good summary gives the answer, the reason and the action in three sentences, with the analysis available behind it.
Common mistakes
MistakeRising revenue and stable profit mean a company is healthy.
InsteadCheck cash flow, working capital and ROIC; growth can consume capital and destroy value.
MistakeA current ratio above 2 means there is no liquidity risk.
InsteadLook at the quick ratio and inventory aging; current assets may be hard to turn into cash.
MistakeA financial diagnosis is a list of ratios.
InsteadIt is an explanation of what drives results, tied to operating causes and supported by evidence.
MistakeBoard recommendations should present all the analysis first.
InsteadLead with the answer and the conditions, then provide the evidence.
MistakeIncentives are a human resources matter, not an accounting one.
InsteadMeasures used for bonuses shape decisions; misaligned measures often create the problems analysis uncovers.
Summary and key terms
- A diagnosis starts with understanding the business model, seasonality, channels and accounting policies.
- Trend analysis of margins, profit and cash flow reveals whether growth is creating value.
- The cash conversion cycle and accruals ratio measure how much profit is tied up in working capital.
- DuPont analysis and ROIC separate operating performance from leverage and compare returns with the cost of capital.
- Leverage, coverage and covenant headroom determine whether new investment can be financed safely.
- Activity-based channel and product analysis reveals the operating causes behind the financial results.
- A good recommendation leads with the answer, ties numbers to causes, sets monitorable conditions and aligns incentives.
- Financial diagnosis
- An integrated analysis of a company's performance, financial position and their causes.
- Covenant headroom
- The margin between a company's ratios and the limits in its loan agreements.
- Channel profitability
- Contribution earned in each sales channel after channel-specific costs.
- Inventory aging
- The analysis of inventory by how long it has been held.
- Cost of complexity
- Costs created by a wide range of products, options or customers.
- Staged investment
- Committing capital in tranches conditional on results.
- Economic profit
- NOPAT minus a charge for capital at the cost of capital.
- Sensitivity analysis
- Testing how results change when key assumptions change.
- Board summary
- A brief statement of the answer, the evidence and the recommended action.
- Value destruction
- Investing capital that earns less than its cost.
Practice problems
Work each problem on paper first, then reveal the answer to check.
Cedarline's inventory is 128 million dollars and cost of goods sold about 235 million. What is days inventory outstanding?
Show answer
About 199 days.
If DIO falls by 40 days, roughly how much cash is released?
Show answer
About 40 / 365 × 235 ≈ 26 million dollars.
Why did Cedarline's net income stay flat while operating profit rose?
Show answer
Interest costs rose as debt grew to fund working capital and capital spending.
Name two non-financial measures the board should monitor monthly.
Show answer
For example, inventory aging, style count, new-store sales ramp, customer return rates.
Why change the bonus from revenue growth to economic profit?
Show answer
So that managers are rewarded only for growth that earns more than the cost of the capital it uses.
Portfolio task: carry out the seven-step diagnosis on a public company of your choice and write a one-page board summary.
Show answer
Answers vary.
Lesson quiz · 5 questions
Score 60% or more to complete this lesson.
Create a free account to save your progress, take quizzes and earn a certificate.