
HSE-223 · Lesson 9 of 12 · 32 min
Fault tree and event tree analysis
Fault tree analysis (FTA) and event tree analysis (ETA) are the two classic logic-diagram methods for analyzing how failures combine. A fault tree works backwards from an undesired top event to find the combinations of basic failures that cause it. An event tree works forwards from an initiating event to show the possible outcomes, depending on whether safety functions succeed or fail. Fault trees were developed at Bell Laboratories in 1962 for the Minuteman missile launch control system; event trees were developed for the nuclear industry, most famously in the 1975 Reactor Safety Study (WASH-1400). Both are described in IEC 31010, and FTA has its own standard, IEC 61025. This lesson gives you enough to read and check simple trees and do the basic arithmetic; large trees are built with software by specialists.
Fault tree symbols and logic
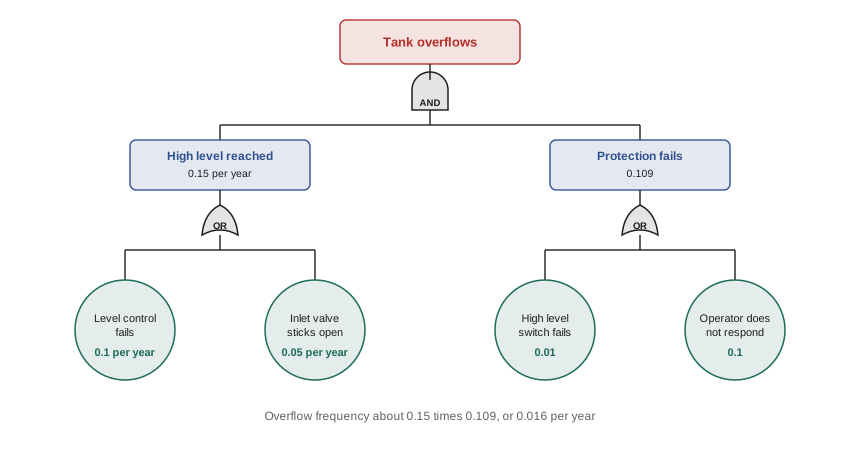
A fault tree starts with the top event, such as "tank overflows" or "explosion in dryer", drawn as a rectangle at the top. Below it, the analyst asks: what immediate events, alone or together, could cause this? Those events are connected to the top event through logic gates. An OR gate means any one of the input events causes the output. An AND gate means all inputs must occur together. The analysis continues downward until it reaches basic events, drawn as circles, for which failure data exist, such as "level transmitter fails low" or "operator does not respond to alarm". Undeveloped events, drawn as diamonds, are not broken down further.
Fault tree arithmetic
For independent events with small probabilities, the arithmetic is straightforward. For an AND gate, multiply the probabilities of the inputs. For an OR gate, the exact result is one minus the product of the probabilities that each input does not happen, but when the probabilities are small, adding them gives a close approximation (the rare event approximation). When combining a frequency (events per year) with probabilities (per demand), the result is a frequency: an initiating frequency AND a failure probability gives the frequency of the outcome.
Worked problem
Calculating the tank overflow tree
In the figure, level control fails 0.1 times per year and the inlet valve sticks open 0.05 times per year. The high level switch has a probability of failure on demand of 0.01, and the operator fails to respond with probability 0.1. The protection fails if the switch fails OR the operator fails to respond (the switch alarms to the operator). Calculate the overflow frequency.
Show solution
- High level reached (OR of frequencies): \( 0.1 + 0.05 = 0.15 \) per year.
- Protection fails (OR of probabilities): \( 1 - (1 - 0.01)(1 - 0.1) = 1 - 0.891 = 0.109 \). The approximation gives 0.11.
- Overflow (AND): \( 0.15 \times 0.109 \approx 0.016 \) per year.
- About one overflow in 60 years. Most of the failure probability comes from the operator, so an automatic trip would help more than a better switch.
Answer: About \( 1.6 \times 10^{-2} \) per year, or one in 60 years.
Minimal cut sets
A cut set is a combination of basic events that, if all occur, causes the top event. A minimal cut set is one that cannot be reduced: remove any event and the top event no longer happens. In the tank example, the minimal cut sets are {level control fails, switch fails}, {level control fails, operator no response}, {valve sticks, switch fails} and {valve sticks, operator no response}. Each has two events, meaning two independent failures are needed. A minimal cut set with a single event is a single point of failure and a priority for improvement. Cut sets also show which basic events appear most often and contribute most to the top event, guiding where to spend money.
Worked problem
Finding the dominant cut set
Using the data from the previous example, calculate the frequency of each minimal cut set and identify the largest contributor.
Show solution
- Level control and switch: \( 0.1 \times 0.01 = 0.001 \) per year.
- Level control and operator: \( 0.1 \times 0.1 = 0.01 \) per year.
- Valve and switch: \( 0.05 \times 0.01 = 0.0005 \) per year.
- Valve and operator: \( 0.05 \times 0.1 = 0.005 \) per year.
- Total: \( 0.0165 \) per year, matching the rare event approximation. The largest is level control and operator, about 61 percent of the total.
Answer: Level control failure combined with no operator response contributes about 61 percent.
Common cause failure
Fault tree arithmetic assumes that basic events are independent. In reality, a single cause can defeat several components: two pumps fed from the same power supply, two sensors on the same impulse line, two operators misled by the same faulty display, or redundant components installed by the same technician with the same error. Common cause failures can make a redundant system far less reliable than the simple AND calculation suggests. The beta factor model, used in IEC 61508 and IEC 61511, assumes a fraction beta, often 2 to 10 percent, of failures affects all redundant channels at once. Good practice is to look for shared utilities, locations, maintenance and design, and to use diversity: different technologies or suppliers for redundant items.
Worked problem
Effect of common cause
Two independent pressure trips each have a probability of failure on demand of 0.01. Calculate the probability that both fail, (a) assuming independence and (b) with a beta factor of 5 percent for common cause failure.
Show solution
- (a) Independent: \( 0.01 \times 0.01 = 0.0001 \).
- (b) Common cause part: \( 0.05 \times 0.01 = 0.0005 \). Independent part: \( (0.95 \times 0.01)^2 \approx 0.00009 \).
- Total: \( 0.0005 + 0.00009 \approx 0.0006 \).
- Common cause makes the pair about six times less reliable than independence suggests.
Answer: (a) \( 1 \times 10^{-4} \); (b) about \( 6 \times 10^{-4} \), dominated by common cause.
Event trees
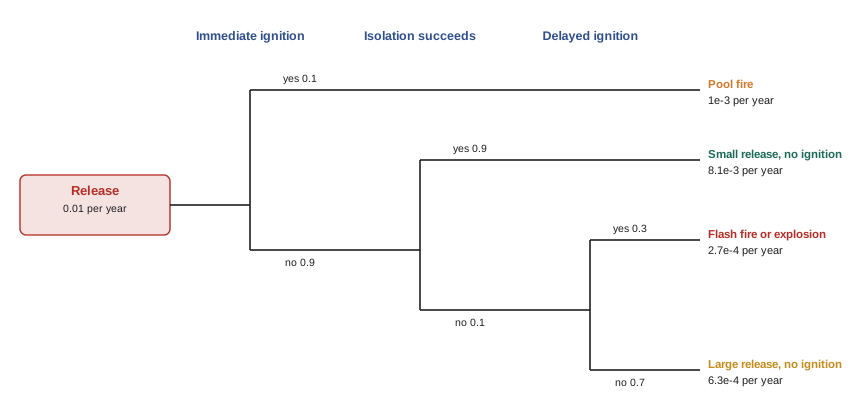
An event tree starts with an initiating event, such as a loss of containment or a pump seal failure, on the left. The analyst lists the safety functions or conditions that affect the outcome, in time order, across the top, such as gas detection, isolation, immediate ignition and delayed ignition. At each heading, the tree branches into success (usually upward) and failure (downward), with a probability for each. Each path through the tree ends in an outcome, and the frequency of that outcome is the initiating frequency multiplied by the branch probabilities along the path.
Worked problem
Calculating event tree outcomes
A flammable liquid release occurs 0.01 times per year. The probability of immediate ignition is 0.1, giving a pool fire. If not immediately ignited, isolation succeeds with probability 0.9, giving a small release with no ignition. If isolation fails, delayed ignition occurs with probability 0.3, giving a flash fire or explosion; otherwise there is a large release with no ignition. Calculate each outcome frequency.
Show solution
- Pool fire: \( 0.01 \times 0.1 = 1 \times 10^{-3} \) per year.
- Small release, no ignition: \( 0.01 \times 0.9 \times 0.9 = 8.1 \times 10^{-3} \).
- Flash fire or explosion: \( 0.01 \times 0.9 \times 0.1 \times 0.3 = 2.7 \times 10^{-4} \).
- Large release, no ignition: \( 0.01 \times 0.9 \times 0.1 \times 0.7 = 6.3 \times 10^{-4} \).
- Check: the outcomes sum to \( 0.01 \), the initiating frequency.
Answer: Pool fire \( 10^{-3} \); small release \( 8.1 \times 10^{-3} \); flash fire or explosion \( 2.7 \times 10^{-4} \); large release \( 6.3 \times 10^{-4} \) per year.
Data and uncertainty
The numbers in fault and event trees come from equipment failure databases such as OREDA for offshore equipment and the CCPS Process Equipment Reliability Database, from manufacturers' data, from plant maintenance records, and from human reliability methods such as THERP or HEART for human error probabilities. Every number has uncertainty, often a factor of three to ten. Results should be presented as orders of magnitude, with the key assumptions and the dominant contributors stated, rather than as precise figures. Sensitivity analysis, changing the most uncertain inputs to see how much the result moves, is good practice.
Fault and event trees are powerful because they show combinations, quantify the effect of redundancy, and identify the most important contributors. They are limited by the quality of data, the analyst's skill in building the logic and the difficulty of modeling human and organizational factors. In practice, they are used for specific high-consequence scenarios, for the design of safety systems and as building blocks of quantitative risk assessment (Lesson 11). The bowtie of Lesson 8 can be seen as a simplified fault tree and event tree joined at the top event.
In the US, fault tree analysis is a PHA method named in OSHA 1910.119(e), and fault and event trees are central to probabilistic risk assessment at nuclear plants under the Nuclear Regulatory Commission and to the design of safety instrumented systems to ANSI/ISA 61511, the US adoption of IEC 61511.
Building a fault tree step by step
Fault tree construction follows a few simple rules. Define the top event precisely, including the system boundary and operating state, such as "reactor R-1 pressure exceeds 15 bar during normal operation". At each level, ask what immediate, necessary and sufficient causes could produce the event above it, and resist the temptation to jump straight to basic component failures. Write each event as a fault statement describing what is wrong and when. Complete each gate fully before moving down the tree. And stop at events for which reliable data exist or which are outside the scope.
Human errors belong in fault trees as basic events, with probabilities from human reliability analysis. Typical screening values are about 0.1 for failure to respond correctly to an alarm under stress with little time, 0.01 for an error in a routine, well-practiced task, and 0.001 for a simple, highly practiced action with good feedback. These numbers are rough and depend strongly on the conditions, which is why human factors reviews of alarms, displays and procedures matter.
Worked problem
Adding redundancy to the tank tree
Return to the tank overflow example (high level reached at 0.15 per year). The company adds an independent automatic high-high level trip with a PFD of 0.01 in parallel with the existing protection (switch and operator, failure probability 0.109). Both protections must fail for overflow. Assuming independence, what is the new overflow frequency?
Show solution
- Both protections fail (AND): \( 0.109 \times 0.01 = 1.09 \times 10^{-3} \).
- Overflow: \( 0.15 \times 1.09 \times 10^{-3} \approx 1.6 \times 10^{-4} \) per year.
- The frequency falls by a factor of 100, from about one in 60 years to about one in 6,000 years, if the trip is truly independent of the level control and the existing switch.
Answer: About \( 1.6 \times 10^{-4} \) per year, a hundredfold improvement if independence holds.
Common mistakes
MistakeMultiplying two frequencies at an AND gate.
InsteadCombine a frequency with probabilities; two frequencies cannot simply be multiplied.
MistakeAssuming redundant components are always independent.
InsteadCheck for common causes and use a beta factor or diversity.
MistakeReporting a result as 1.637 × 10⁻⁴ per year.
InsteadReport orders of magnitude with assumptions and dominant contributors.
MistakeForgetting to check that event tree outcomes sum to the initiating frequency.
InsteadAlways check the sum as an arithmetic test.
MistakeIgnoring single-event minimal cut sets.
InsteadTreat single points of failure as priorities for improvement.
Summary and key terms
- Fault trees work backwards from a top event; event trees work forwards from an initiating event.
- OR gates add (approximately) and AND gates multiply for independent events.
- A frequency combined with probabilities gives a frequency of the outcome.
- Minimal cut sets show the combinations that cause the top event and the dominant contributors.
- Common cause failures can make redundancy far less effective; use beta factors and diversity.
- Event tree outcome frequencies are the initiating frequency times branch probabilities.
- Data are uncertain; report orders of magnitude and test sensitivity.
- Fault tree
- A top-down logic diagram showing combinations of failures causing a top event.
- Event tree
- A forward logic diagram showing outcomes of an initiating event.
- OR gate
- A gate where any input causes the output.
- AND gate
- A gate where all inputs must occur to cause the output.
- Basic event
- A failure at the lowest level of a fault tree with data available.
- Minimal cut set
- The smallest combination of basic events that causes the top event.
- Rare event approximation
- Adding small probabilities to approximate an OR gate.
- Common cause failure
- A single cause that defeats several components at once.
- Beta factor
- The fraction of failures assumed to affect all redundant channels.
- Initiating event
- The first event in an event tree, such as a release.
Practice problems
Work each problem on paper first, then reveal the answer to check.
Does a fault tree work forwards or backwards?
Show answer
Backwards, from the top event to causes.
What does an AND gate mean?
Show answer
All inputs must occur for the output to occur.
Two independent probabilities are 0.02 and 0.05. What is the AND result?
Show answer
0.001.
Approximate the OR result for 0.02 and 0.05.
Show answer
About 0.07.
What is a minimal cut set?
Show answer
The smallest combination of basic events that causes the top event.
Why is a single-event cut set important?
Show answer
It is a single point of failure.
What does a beta factor represent?
Show answer
The fraction of failures affecting all redundant channels together.
An initiating event occurs 0.1 per year, and a barrier fails with probability 0.05. What is the outcome frequency?
Show answer
0.005 per year.
What check should you make on an event tree?
Show answer
The outcome frequencies sum to the initiating frequency.
Name a source of equipment failure data.
Show answer
OREDA, the CCPS process equipment reliability database, or plant records.
Lesson quiz · 5 questions
Score 60% or more to complete this lesson.
Create a free account to save your progress, take quizzes and earn a certificate.