
HSE-223 · Lesson 11 of 12 · 29 min
Quantitative risk assessment, tolerability and ALARP
Quantitative risk assessment (QRA), also called quantitative risk analysis or, in some industries, probabilistic risk assessment, puts numbers on both sides of risk: how often harmful outcomes are expected and how severe they would be, usually expressed as the risk of death to individuals and to groups of people. It is the most demanding method in this course, used mainly for major hazard facilities such as refineries, chemical plants, LNG terminals, pipelines and explosives sites, for land use planning around them, and for decisions about expensive safety investments. Lesson 1 introduced risk criteria and ALARP. This lesson shows how a QRA is built, how its results are presented and judged against criteria, and how cost-benefit analysis supports ALARP decisions.
Most safety professionals will never run a QRA themselves; it requires consequence modeling software, failure data and specialist expertise. But many will commission one, review one, or have to explain its results to managers, regulators or the public. The aim here is to understand the logic and the outputs well enough to ask the right questions.
The steps of a QRA
A QRA follows a standard sequence, described in the CCPS Guidelines for Chemical Process Quantitative Risk Analysis and in the Dutch Purple Book. First, identify hazards and select representative release scenarios, such as small, medium and large leaks and full rupture for each major item. Second, estimate the frequency of each release using failure data, fault trees and event trees. Third, model the consequences: discharge rate, dispersion of toxic or flammable clouds, fire and explosion effects, and their effects on people using probit or threshold models. Fourth, combine frequencies and consequences across all scenarios, weather conditions and wind directions. Fifth, present the results as individual and societal risk and compare them with criteria. Finally, identify the main contributors and test risk reduction options.
| Step | Main output | Typical tools |
|---|---|---|
| Hazard identification and scenario selection | List of representative releases | HAZOP, what-if, previous studies |
| Frequency analysis | Release frequency per scenario | Failure databases, fault and event trees |
| Consequence analysis | Hazard zones for fire, explosion and toxic effects | Dispersion, fire and explosion models |
| Effect on people | Probability of fatality at each location | Probit functions, thresholds |
| Risk integration | Individual and societal risk | QRA software combining weather and wind |
| Assessment | Comparison with criteria; risk reduction options | Criteria, cost-benefit analysis |
Individual risk
Individual risk is the frequency at which a person at a given location would be expected to be killed, usually per year. Location-specific individual risk (LSIR) assumes a person is present outdoors at that point all the time, so it is a property of the place and is used for land use planning. Individual risk per annum (IRPA) for a worker takes account of the time actually spent in each area, so it is a property of a person or job and is used to judge worker risk. Results are often drawn as risk contours on a site map, joining points of equal individual risk, such as \( 10^{-4} \), \( 10^{-5} \) and \( 10^{-6} \) per year.
Worked problem
Calculating worker IRPA
A QRA gives location-specific individual risk of \( 2 \times 10^{-4} \) per year in a process area and \( 1 \times 10^{-5} \) per year in the control room. An operator works 2,000 hours a year, spending 25 percent of that time in the process area and 75 percent in the control room. The year has 8,760 hours. Calculate the operator's IRPA.
Show solution
- Time in process area: \( 0.25 \times 2{,}000 = 500 \) h, fraction of year \( 500 \div 8{,}760 \approx 0.057 \).
- Time in control room: \( 1{,}500 \) h, fraction \( 1{,}500 \div 8{,}760 \approx 0.171 \).
- IRPA \( = 2 \times 10^{-4} \times 0.057 + 1 \times 10^{-5} \times 0.171 \approx 1.14 \times 10^{-5} + 0.17 \times 10^{-5} \approx 1.3 \times 10^{-5} \) per year.
- Most of the risk comes from time in the process area, even though it is only a quarter of working hours.
Answer: About \( 1.3 \times 10^{-5} \) per year, dominated by time in the process area.
Societal risk and F-N curves
Individual risk does not show how many people could be harmed at once. A facility next to a stadium may have the same individual risk contours as one next to a field, but a single accident could kill hundreds. Societal risk captures this. It is usually shown as an F-N curve: a graph with the number of fatalities N on the horizontal axis and the cumulative frequency F of accidents causing N or more fatalities on the vertical axis, both on logarithmic scales. Criterion lines on the graph define intolerable, ALARP and broadly acceptable regions.
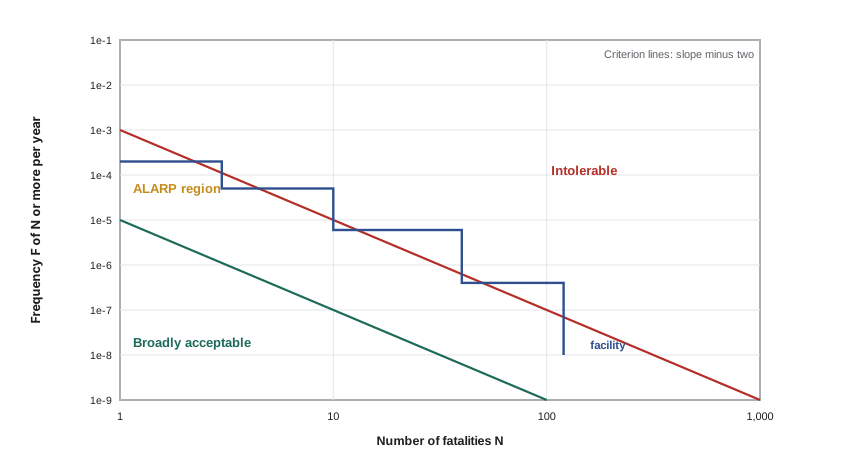
Criterion lines usually have a slope of minus one or steeper. A slope of minus one means an accident killing 10 people is tolerable at one tenth the frequency of one killing a single person, so the expected number of deaths per year is the same. A slope of minus two, as in the Dutch criterion of \( 10^{-3}/N^2 \) per year for new establishments, builds in aversion to large accidents: 10 deaths must be 100 times less frequent than one. Whether such aversion is justified is debated, but it reflects public and political reaction to disasters.
Worked problem
Checking a point against an F-N criterion
A QRA finds the frequency of accidents causing 20 or more fatalities is \( 5 \times 10^{-6} \) per year. Compare it with (a) the Dutch criterion \( 10^{-3}/N^2 \) and (b) a neutral criterion \( 10^{-3}/N \).
Show solution
- (a) \( 10^{-3} \div 20^2 = 10^{-3} \div 400 = 2.5 \times 10^{-6} \). The facility at \( 5 \times 10^{-6} \) exceeds this by a factor of 2.
- (b) \( 10^{-3} \div 20 = 5 \times 10^{-5} \). The facility is 10 times below this line.
- The same result fails the risk-averse criterion and passes the neutral one; the choice of criterion matters.
Answer: It exceeds the Dutch line by a factor of 2 but is ten times below the neutral line.
Land use planning criteria
In the US, there is no federal risk-based land use criterion. EPA RMP requires facilities to model worst-case and alternative release scenarios and report the distance to toxic or flammable endpoints, which local emergency planners use, and some states and municipalities set their own siting rules. Many companies and consultants use international criteria, such as the UK HSE's or the Canadian MIACC guidelines, for example individual risk of \( 10^{-6} \) per year for residential areas, when advising on siting. API RP 752 and 753 address the siting of occupied buildings within facilities.
ALARP and cost-benefit analysis
Between the intolerable and broadly acceptable regions, risk must be reduced as low as reasonably practicable. In practice, this means a measure must be implemented unless its cost is grossly disproportionate to the risk reduction it achieves. Cost-benefit analysis gives a structured way to judge this. The benefit of a measure is the reduction in expected fatalities per year, multiplied by the value of a statistical life (VSL) and by the remaining life of the facility, often with discounting. The cost includes capital, operating and maintenance costs over the same period. If the cost is less than the benefit multiplied by a disproportion factor, the measure is reasonably practicable and should be done.
The value of a statistical life is not the value of any person's life. It is the amount society is willing to pay to reduce risk so that, on average, one fewer death is expected. It is derived from studies of how much people accept in wages for riskier jobs or pay for safety features, and it is used so that safety spending is consistent across decisions.
In the US, the Department of Transportation's guidance set the VSL at $14.2 million for the 2025 base year, and other federal agencies use similar values. The disproportion factor (DF) is not set by US law; companies often borrow the UK practice of factors from about 2 for low risks to 10 or more for risks near the intolerable limit, and OSHA's feasibility test under the General Duty Clause is a related but separate idea.
Worked problem
Is the measure reasonably practicable?
A QRA shows that adding a remotely operated isolation valve reduces the potential loss of life (PLL) at a terminal from \( 4 \times 10^{-3} \) to \( 1 \times 10^{-3} \) fatalities per year. The facility has 20 years of remaining life. The valve costs $450,000 installed plus $10,000 a year to maintain. Use a VSL of $14.2 million and a disproportion factor of 3, ignoring discounting. Should the valve be installed?
Show solution
- Reduction in PLL: \( 4 \times 10^{-3} - 1 \times 10^{-3} = 3 \times 10^{-3} \) per year.
- Benefit: \( 3 \times 10^{-3} \times 14{,}200{,}000 \times 20 = \$852{,}000 \).
- Cost: \( 450{,}000 + 10{,}000 \times 20 = \$650{,}000 \).
- Threshold: \( 3 \times 852{,}000 = \$2{,}556{,}000 \). The cost of $650,000 is well below this.
- The cost is not grossly disproportionate, so the valve is reasonably practicable and should be installed.
Answer: Yes. The cost is far below the disproportion threshold, so the valve should be installed.
Cost-benefit analysis supports judgment; it does not replace it. It cannot justify keeping a risk in the intolerable region, it should not be used to remove existing controls that are good practice, and the numbers are uncertain. Regulators such as the UK HSE warn against using it to argue away recognized good practice. It is most useful for choosing among options and for documenting why a measure was or was not adopted.
Uncertainty and limitations
QRA results are uncertain, often by an order of magnitude or more. Different consultants analyzing the same facility have produced results differing by factors of 10 to 100, as shown in the European ASSURANCE benchmark study in the early 2000s. Sources include failure data, release scenario choice, dispersion models, ignition probabilities and assumptions about people's presence and escape. A QRA should state its assumptions, show which scenarios dominate, and include sensitivity analysis. Results near a criterion line should be treated with caution in both directions: a result just below a line is not proof of safety, and one just above is a signal to look closely, not automatic proof of danger.
Commissioning a QRA well matters as much as reading one. The terms of reference should state the purpose, such as land use advice or comparing design options, the criteria to be used, the scenarios and populations to include, and the level of detail. The client should ask for the input data and assumptions to be listed, for the dominant contributors to be identified and for sensitivity cases on the most uncertain inputs.
Common mistakes
MistakeUsing LSIR to judge the risk to a particular worker.
InsteadUse IRPA, which accounts for time spent in each area.
MistakeJudging a large facility only by individual risk.
InsteadAssess societal risk with an F-N curve as well.
MistakeUsing cost-benefit analysis to justify an intolerable risk.
InsteadReduce intolerable risks regardless of cost; use CBA only within the ALARP region.
MistakePresenting QRA results as precise figures.
InsteadReport orders of magnitude with assumptions and sensitivity analysis.
MistakeTreating the VSL as the value of a person.
InsteadExplain it as willingness to pay for small risk reductions across many people.
Summary and key terms
- QRA estimates frequencies and consequences to express risk as individual and societal measures.
- The steps are hazard identification, frequency, consequence, effect on people, integration and assessment.
- LSIR is a property of a place; IRPA is a property of a person or job.
- Societal risk is shown on F-N curves; steeper criterion lines express aversion to large accidents.
- US land use relies on RMP endpoint distances, local rules and borrowed international criteria.
- ALARP decisions compare cost with benefit times a disproportion factor, using a VSL.
- QRA results are uncertain; state assumptions and test sensitivity.
- Quantitative risk assessment
- A method estimating risk numerically from frequencies and consequences.
- Location-specific individual risk
- The annual risk of death for a person present at a location all the time.
- Individual risk per annum
- The annual risk of death for a specific person or job.
- Societal risk
- The relationship between the frequency and number of people harmed in accidents.
- F-N curve
- A graph of cumulative frequency against number of fatalities.
- Risk contour
- A line on a map joining points of equal individual risk.
- Potential loss of life
- The expected number of fatalities per year.
- Value of a statistical life
- Willingness to pay for risk reductions that save one life on average.
- Disproportion factor
- The multiple by which cost must exceed benefit to be grossly disproportionate.
- Probit
- A function relating exposure to the probability of an effect such as death.
Practice problems
Work each problem on paper first, then reveal the answer to check.
What is the difference between LSIR and IRPA?
Show answer
LSIR assumes constant presence at a place; IRPA accounts for actual time spent.
What does an F-N curve show?
Show answer
The cumulative frequency of accidents causing N or more fatalities.
What does a slope of minus two on an F-N criterion mean?
Show answer
Aversion to large accidents: ten times the deaths must be 100 times less frequent.
Using 1e-3/N^2, what is the limit for N = 10?
Show answer
1e-5 per year.
Name the main steps of a QRA.
Show answer
Hazard identification, frequency analysis, consequence analysis, effect on people, integration, assessment.
What is PLL?
Show answer
Potential loss of life: expected fatalities per year.
A measure reduces PLL by 1e-3 per year for 10 years. With a VSL of $10 million, what is the benefit?
Show answer
$100,000.
With a DF of 5, what cost would be grossly disproportionate for that benefit?
Show answer
More than $500,000.
Can CBA justify an intolerable risk?
Show answer
No.
Why report QRA results as orders of magnitude?
Show answer
Because inputs are uncertain, often by a factor of ten or more.
Lesson quiz · 5 questions
Score 60% or more to complete this lesson.
Create a free account to save your progress, take quizzes and earn a certificate.