
GEOM-430 · Lesson 7 of 12 · 20 min
Sea level and ocean geodesy
Sea level is the oldest reference surface in surveying. For centuries, heights were measured from mean sea level, determined at a tide gauge and carried inland by leveling. GEOM-360 showed how hydrographers reduce soundings to chart datums defined by the tides. This lesson takes the wider geodetic view: how sea level is measured from the land and from space, why the sea surface is not the geoid, and how geodesy has made it possible to measure the rise of the global ocean to a fraction of a millimeter per year.
The connection to Coulee Geomatics comes through Mira Sandvik, the hydrographer the firm worked with on the Tacoma berth. The port authority has asked for an estimate of sea level change at the berth over its 50-year design life. Mira brings the question to Leah, because the answer depends less on hydrography than on reference frames.
Tide gauges: relative sea level
A tide gauge measures the height of the water relative to a benchmark on land, usually every minute or every six minutes. Averaged over a year, the tides, waves and weather largely cancel and the result is annual mean sea level at the gauge. Some records go back more than a century and a half. The Permanent Service for Mean Sea Level, hosted in the United Kingdom, collects and publishes these records from around the world, and agencies in both Canada and the United States contribute to it.
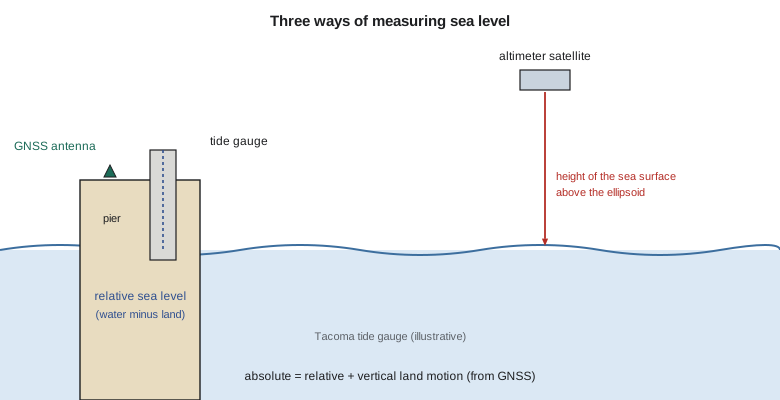
What a tide gauge measures is relative sea level: the height of the sea relative to the land on which the gauge stands. If the land is rising, the gauge shows sea level falling, even if the ocean is rising; if the land is sinking, the gauge exaggerates the rise. For coastal engineering, relative sea level is exactly what matters, because a wharf moves with the land. For understanding the ocean, the motion of the land must be removed.
Vertical land motion
The land at tide gauges moves for many reasons: glacial isostatic adjustment, tectonic strain, compaction of sediments, groundwater or hydrocarbon extraction, and the settlement of the structure the gauge is mounted on. Since the 2000s, many tide gauges have had a continuous GNSS station installed on or near them, with a leveling tie between the GNSS antenna and the gauge's benchmark. The GNSS gives the vertical velocity of the land in the ITRF, and adding it to the relative trend gives the geocentric, or absolute, sea level trend. An IGS working group, known by the acronym TIGA, coordinates GNSS processing at tide gauges for this purpose.
The equation is simple, but the land term is hard to get right. A vertical velocity good to 0.3 mm per year needs a long, continuous GNSS record, a stable monument, a well-defined frame, and a careful leveling tie, repeated to check that the gauge and the GNSS antenna are not moving relative to each other. The vertical stability of the ITRF matters too: an error in the frame's origin along the Earth's axis, of only a fraction of a millimeter per year, appears as a spurious vertical velocity that varies with latitude. This is one of the main reasons the Global Geodetic Observing System sets its goal of 0.1 mm per year for frame stability.
Computing a trend
The code fits a straight line to 30 years of illustrative annual mean sea levels at the Tacoma gauge, then applies a GNSS vertical velocity to obtain the absolute trend.
# Sea level trend at a tide gauge, corrected for vertical land motion.
years = list(range(1996, 2026))
# Annual mean sea level, mm above a gauge datum (illustrative series built from a trend plus year-to-year noise)
noise = [12, -8, 20, 5, -15, 3, -2, 9, -11, 6, 14, -6, -3, 8, 22, -10, 1, -7, 10, 4, -12, 7, -1, 15, -9, 2, 11, -4, 6, -2]
rel_trend = 2.4                          # mm/yr built into the series
msl = [7000 + rel_trend * (y - 1996) + n for y, n in zip(years, noise)]
n = len(years); my = sum(years) / n; ms = sum(msl) / n
sxx = sum((y - my) ** 2 for y in years)
b = sum((y - my) * (m - ms) for y, m in zip(years, msl)) / sxx
res = [m - (ms + b * (y - my)) for y, m in zip(years, msl)]
s = (sum(r * r for r in res) / (n - 2)) ** 0.5
sb = s / sxx ** 0.5
print(f"relative sea level trend {b:+.2f} +/- {sb:.2f} mm/yr (1 sigma, ignoring serial correlation)")
vlm = -0.5                                # GNSS vertical velocity at the gauge, mm/yr
print(f"GNSS vertical land motion {vlm:+.2f} mm/yr")
print(f"absolute (geocentric) sea level trend {b + vlm:+.2f} mm/yr")
print(f"global altimetry average 1993 onward about +3.3 mm/yr; recent years about +4.5 mm/yr")
print(f"relative change over 2026-2076 at this trend: {b * 50:+.0f} mm")relative sea level trend +2.35 +/- 0.21 mm/yr (1 sigma, ignoring serial correlation) GNSS vertical land motion -0.50 mm/yr absolute (geocentric) sea level trend +1.85 mm/yr global altimetry average 1993 onward about +3.3 mm/yr; recent years about +4.5 mm/yr relative change over 2026-2076 at this trend: +117 mm
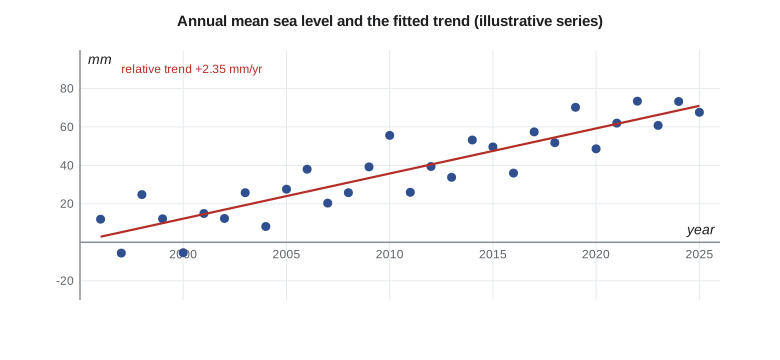
The relative trend is about +2.4 mm per year, with a formal uncertainty of about 0.2 mm per year. The formal value is too small, because year-to-year sea level is correlated, driven by ocean and climate cycles such as El Niño and the Pacific Decadal Oscillation, and a realistic uncertainty is perhaps two or three times larger. The land at the gauge is sinking by about 0.5 mm per year in this example, so the absolute trend is about +1.9 mm per year, below the global average because of regional ocean dynamics over the period. Over a 50-year design life, the relative trend alone would add about 12 cm at the wharf. But a trend from the last 30 years is not a forecast: the global rate has roughly doubled since the early 1990s, and planning must use projections that include that acceleration.
Satellite altimetry
Since 1992, satellites have measured the height of the sea surface directly. A radar altimeter sends pulses straight down and times the echo from the sea surface. The satellite's orbit, determined by SLR, DORIS and GNSS to about a centimeter, gives its height above the ellipsoid; subtracting the measured range, corrected for the atmosphere, the sea state and the tides, gives the sea surface height above the ellipsoid. Repeated every ten days or so along the same ground tracks, these measurements map the whole ocean between about 66° N and 66° S.
The reference missions form a continuous series: TOPEX/Poseidon from 1992, then Jason-1, Jason-2 and Jason-3, and since 2020 Sentinel-6 Michael Freilich, a joint mission of the United States and Europe. Each new satellite flew for months in the same orbit as its predecessor, so that their biases could be measured and the record joined. The Surface Water and Ocean Topography mission, SWOT, launched in 2022, uses radar interferometry to map a wide swath rather than a single track, and sees features at kilometer scales, including rivers and lakes. Other altimeters, such as those on ICESat-2 (a laser altimeter) and CryoSat-2, are designed mainly for ice.
From this record, global mean sea level is known to have risen by about 11 cm between 1993 and 2023. NASA's analysis found the rate rising from about 2.1 mm per year in 1993 to about 4.5 mm per year in 2024, and the average over the whole record is usually quoted as a little over 3 mm per year. Tide gauges, corrected for land motion, give consistent results where they overlap and extend the record back more than a century, showing a slower rise of about 1.5 to 2 mm per year through most of the twentieth century.
Sea level does not rise evenly. When an ice sheet loses mass, its gravitational pull on the nearby ocean weakens and the crust beneath it rebounds, so sea level near the ice sheet falls while it rises more than average far away. These patterns, called sea level fingerprints, mean that melting in Greenland raises sea level more along the Pacific coast of North America than in the North Atlantic, and melting in Antarctica affects the northern hemisphere strongly. Regional projections take these fingerprints into account, along with changes in ocean currents and the vertical land motion at each site.
The sea surface is not the geoid
If the ocean were at rest, its surface would follow an equipotential surface, essentially the geoid. It is not at rest. Currents, winds, differences in temperature and salinity, and atmospheric pressure all tilt and shape the surface. The difference between the mean sea surface and the geoid is the mean dynamic topography. It reaches about two meters in total range around the world. Across the Gulf Stream, for example, the sea surface drops by about a meter over a hundred kilometers.
Geodesy and oceanography meet here. Altimetry gives the mean sea surface to a few centimeters; a geoid from GOCE and GRACE gives N; their difference gives the mean dynamic topography, from which oceanographers compute the surface currents, since geostrophic flow runs along contours of the topography. GOCE's very name, the Gravity field and steady-state Ocean Circulation Explorer, reflects that purpose. For surveyors, mean dynamic topography explains why mean sea level is not a level surface: mean sea level on the Pacific coast of North America stands several decimeters higher, relative to the geoid, than on the Atlantic coast, which is one reason the old continental datums tied to many tide gauges were distorted.
| Surface | What it is | How it is obtained |
|---|---|---|
| Ellipsoid | A mathematical surface | Defined (GRS80) |
| Geoid | The equipotential surface W = W₀ | Gravity, satellites, Stokes |
| Mean sea surface | The time-averaged sea surface | Altimetry |
| Mean dynamic topography | Mean sea surface minus the geoid | Altimetry and gravity together |
| Chart datum | A low-water surface for depths | Tides at gauges, separation models |
From geodesy to the berth
Mira and Leah put the pieces together for the port. The relative trend at the Tacoma gauge reflects both the global rise and the slight sinking of the land, and the global rate is accelerating. Federal sea level rise projections, such as those of the interagency task force led by NOAA, give regional scenarios that include land motion. They also note that the berth's design depends on extreme water levels, from storm surges and the highest tides, and that those ride on top of mean sea level. The report gives the port the observed relative trend, the GNSS vertical velocity with its frame and epoch, the absolute trend, and the range of projected relative rise to 2076 from the official scenarios, and recommends repeating the leveling tie between the gauge and the GNSS station every five years.
Worked problem
Absolute and relative trends
A tide gauge shows a relative rise of 3.6 mm per year. GNSS at the gauge shows the land sinking at 1.2 mm per year. What is the absolute trend?
Show solution
- \[\dot{h}_{\text{abs}} = 3.6 + (-1.2) = 2.4\ \text{mm/yr}\]
Answer: The ocean surface is rising at about 2.4 mm per year; the sinking land makes the local relative rise faster.
Ocean tides and loading
Geodesy also needs the ocean for a quieter reason. The tides move enormous masses of water twice a day, and the sea floor and coasts bend under the load. Stations within a few hundred kilometers of the coast move up and down by up to a few centimeters with the ocean tides, and GNSS processing must remove that ocean tide loading with a model computed from global tide models, the same models used for altimetry. For CR1, far inland, the effect is a few millimeters at most; for a station on the Pacific coast, it is one of the largest corrections in the vertical.
Common mistakes
MistakeTreating a tide gauge trend as a measure of the global ocean.
InsteadIt is relative to the land; add the vertical land motion to get the absolute trend.
MistakeAssuming mean sea level is an equipotential surface.
InsteadMean dynamic topography makes it differ from the geoid by up to a meter or more.
MistakeExtrapolating a past trend as a projection.
InsteadUse official projections that include acceleration and land motion.
MistakeIgnoring the tie between a tide gauge and its GNSS station.
InsteadMeasure and repeat the leveling tie so the two records refer to the same land.
Summary and key terms
- Tide gauges measure relative sea level, the sea relative to the land.
- GNSS at tide gauges measures vertical land motion, giving absolute trends.
- Satellite altimetry since 1992 measures sea surface height above the ellipsoid.
- Global mean sea level rose about 11 cm from 1993 to 2023; the rate reached about 4.5 mm per year in 2024.
- Mean dynamic topography is the difference between the mean sea surface and the geoid.
- Ocean tide loading moves coastal stations by centimeters and must be modeled.
- Relative sea level
- Sea level measured relative to the land at a tide gauge.
- Absolute sea level
- Sea level relative to the Earth's center or the ellipsoid.
- Vertical land motion
- The vertical velocity of the ground, from GNSS or other measurements.
- Altimetry
- Measurement of sea surface height from a satellite by radar or laser ranging.
- Mean dynamic topography
- The mean sea surface minus the geoid.
- PSMSL
- The Permanent Service for Mean Sea Level, which collects tide gauge records.
Practice problems
Work each problem on paper first, then reveal the answer to check.
A gauge shows a relative fall of 4 mm per year where the land rises 9 mm per year. What is the absolute trend?
Show answer
−4 + 9 = +5 mm per year.
Why are altimetry satellites' orbits needed to centimeter accuracy?
Show answer
Sea surface height is the orbit height minus the measured range.
What is mean dynamic topography?
Show answer
The mean sea surface minus the geoid, caused by ocean circulation.
Why does a frame origin drift matter for sea level?
Show answer
It appears as a spurious vertical velocity at tide gauges.
Which mission maps a wide swath of sea surface height and also rivers and lakes?
Show answer
SWOT.
Lesson quiz · 5 questions
Score 60% or more to complete this lesson.
Create a free account to save your progress, take quizzes and earn a certificate.