
GEOM-430 · Lesson 3 of 12 · 21 min
Plate motion and station velocities
The ground under CR1 is moving. Relative to the global frame, the whole of North America is drifting west-south-west at about the speed fingernails grow. Over a career, the coordinates of a monument in ITRF change by more than half a meter without anything happening to the monument. This lesson explains where that motion comes from, how it is described, and how the measured velocity of a station is split into its parts.
Plates as rigid caps on a sphere
The theory of plate tectonics treats the outer shell of the Earth as a dozen or so large plates and many small ones, each moving as a nearly rigid cap over the hotter mantle beneath. On a sphere, the motion of a rigid cap is a rotation about an axis through the center. Euler's theorem says that any displacement of a rigid body with one fixed point is such a rotation. The point where the axis meets the surface is the Euler pole of the plate, and the rate of rotation is its angular velocity. Together they make an Euler vector, ω.
For a station at position r, the velocity is the cross product of ω and r. It is perpendicular to the plane containing the pole and the station, so it is tangent to small circles around the pole, and its size grows with the angular distance from the pole: zero at the pole itself, greatest 90° away.
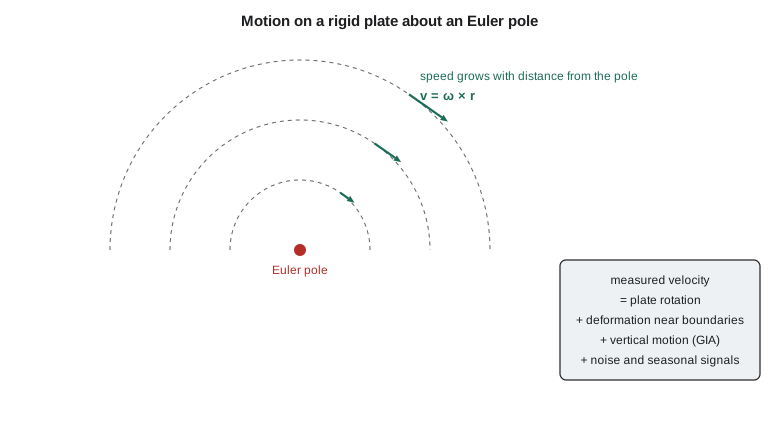
Plate motion models come in two kinds. Geological models, such as NUVEL-1A and MORVEL, use the spreading rates recorded in magnetic stripes on the ocean floor, transform fault directions and earthquake slip vectors, and so describe the average motion over the last few million years. Geodetic models use station velocities from GNSS and the other techniques, and describe motion over the last few decades. For ITRF2014 and ITRF2020 the IERS center published plate motion models estimated from the frame's own velocities. They agree with the geological models well for most plates, which is itself a striking result: plates move at nearly constant rates over millions of years.
North America in the global frame
In ITRF2020, the Euler pole of the North American plate lies near the equator, roughly south of the Gulf of Mexico, and the rate is about 0.19° per million years. That means stations across Canada and the United States all move roughly west-south-west at 15 to 20 mm per year, with the direction swinging from south-west in the far north-west to north-west on the Atlantic coast. The code uses an approximate Euler vector for the plate, labeled approximate because the published values from different solutions differ slightly, to compute velocities at CR1 and three other sites.
import math
# Horizontal velocity of a station on a rigid plate from an Euler vector, v = omega x r.
mas = math.radians(1 / 3.6e6)              # one milliarcsecond in radians
w = [0.03 * mas, -0.69 * mas, -0.02 * mas]  # North America plate in ITRF, rad/yr (approximate)
def geod2ecef(lat, lon, h, a=6378137.0, f=1 / 298.257222101):
    e2 = f * (2 - f); la, lo = math.radians(lat), math.radians(lon)
    N = a / math.sqrt(1 - e2 * math.sin(la) ** 2)
    return ((N + h) * math.cos(la) * math.cos(lo), (N + h) * math.cos(la) * math.sin(lo), (N * (1 - e2) + h) * math.sin(la))
def plate_velocity(lat, lon, h=0.0):
    x, y, z = geod2ecef(lat, lon, h)
    v = (w[1] * z - w[2] * y, w[2] * x - w[0] * z, w[0] * y - w[1] * x)   # m/yr
    la, lo = math.radians(lat), math.radians(lon)
    ve = -math.sin(lo) * v[0] + math.cos(lo) * v[1]
    vn = -math.sin(la) * math.cos(lo) * v[0] - math.sin(la) * math.sin(lo) * v[1] + math.cos(la) * v[2]
    return 1000 * ve, 1000 * vn
pole_lat = math.degrees(math.atan2(w[2], math.hypot(w[0], w[1])))
pole_lon = math.degrees(math.atan2(w[1], w[0]))
rate = math.degrees(math.sqrt(sum(c * c for c in w))) * 1e6
print(f"Euler pole {pole_lat:.1f} N {pole_lon:.1f} E, rate {rate:.3f} deg per million years")
for name, lat, lon in [("CR1 Great Falls", 47.5060, -111.2978), ("Tacoma", 47.27, -122.42), ("Duluth", 46.79, -92.10), ("Boston", 42.36, -71.06)]:
    ve, vn = plate_velocity(lat, lon)
    sp = math.hypot(ve, vn); az = math.degrees(math.atan2(ve, vn)) % 360
    print(f"{name:14s} east {ve:+6.2f} north {vn:+6.2f} mm/yr  speed {sp:5.2f} az {az:5.1f}")
# Compare with a GNSS velocity measured at the first station (invented values)
me, mn = (-14.21, -9.71)
ve, vn = plate_velocity([("CR1 Great Falls", 47.5060, -111.2978), ("Tacoma", 47.27, -122.42), ("Duluth", 46.79, -92.10), ("Boston", 42.36, -71.06)][0][1], [("CR1 Great Falls", 47.5060, -111.2978), ("Tacoma", 47.27, -122.42), ("Duluth", 46.79, -92.10), ("Boston", 42.36, -71.06)][0][2])
print(f"residual at {[("CR1 Great Falls", 47.5060, -111.2978), ("Tacoma", 47.27, -122.42), ("Duluth", 46.79, -92.10), ("Boston", 42.36, -71.06)][0][0]}: east {me - ve:+.2f} north {mn - vn:+.2f} mm/yr")Euler pole -1.7 N -87.5 E, rate 0.192 deg per million years CR1 Great Falls east -14.76 north -8.60 mm/yr speed 17.08 az 239.8 Tacoma east -13.22 north -12.20 mm/yr speed 17.99 az 227.3 Duluth east -15.86 north -1.71 mm/yr speed 15.95 az 263.9 Boston east -14.19 north +6.04 mm/yr speed 15.42 az 293.1 residual at CR1 Great Falls: east +0.55 north -1.11 mm/yr
The approximate Euler pole falls at about 1.7° S, 87.5° W, and the plate rotates at about 0.19° per million years. At CR1 the predicted velocity is about 17.1 mm per year toward azimuth 240°, south-west. Tacoma, on Puget Sound, moves more to the south; Duluth, on Lake Superior, moves almost due west; and Boston moves west-north-west. The difference in direction across the country comes from the geometry of rotation about a pole far to the south.
The final lines compare the model with a velocity Leah estimated for CR1 from three years of its early data (an illustrative value). The residual is about half a millimeter per year east and about one millimeter per year south. Residuals of that size at a station far from any plate boundary are expected. They come partly from errors in the Euler vector and in the station's short record, and partly from real motion that is not plate rotation, which is the subject of the rest of the lesson.
What else is in a velocity
A station's measured velocity can be written as a sum of parts, and separating them is a large part of geodetic research.
| Part | Typical size in North America | Cause |
|---|---|---|
| Rigid plate rotation | 15 to 20 mm/yr horizontal | Mantle convection carrying the plate |
| Boundary deformation | up to tens of mm/yr near the west coast | Locked faults, subduction, spreading |
| Glacial isostatic adjustment | up to about 1 cm/yr vertical around Hudson Bay | Slow recovery of the crust after the ice sheets melted |
| Local motion | mm to cm per year | Groundwater pumping, landslides, monument instability |
| Noise and seasonal signals | mm | Loading, multipath, antenna and processing changes |
Near plate boundaries the plates are not rigid. Along the Pacific coast, the Juan de Fuca plate is pushed beneath North America at the Cascadia subduction zone, and the locked interface drags the coast eastward a few millimeters per year until the next great earthquake releases it. Further south, the San Andreas system takes up most of the motion between the Pacific and North American plates over a zone hundreds of kilometers wide. Lesson 8 shows how geodesists turn such velocities into strain rates and fault slip rates.
Far from the boundaries, the main deviation from rigid rotation is vertical. During the last glaciation, the Laurentide ice sheet, up to three kilometers thick, pressed the crust down over most of Canada and the northern United States. The ice melted thousands of years ago, but the mantle flows so slowly that the land is still rebounding. Around Hudson Bay the uplift is about a centimeter per year; south of the former ice margin, in a band across the northern United States and southern Canada, the former peripheral bulge is slowly sinking. Glacial isostatic adjustment, or GIA, also has a small horizontal component, generally directed away from the former center of loading.
Measuring a velocity in practice
A station velocity is the slope of its position time series. Processing a continuously operating station day by day gives one position per day, each with a precision of a few millimeters horizontally and somewhat worse vertically. Fitting a straight line plus annual and semi-annual terms to several years of such positions gives the velocity, but the uncertainty of that slope depends strongly on the noise model. If daily positions are treated as independent, the formal uncertainty after five years is a few hundredths of a millimeter per year, which is far too optimistic. Correlated noise, of the kind lesson 9 discusses, raises the realistic uncertainty by a factor of five or ten. Analysts therefore use noise models estimated from the time series itself, and they report velocities with realistic uncertainties.
Campaign GNSS is the other approach: occupying a monument for a few days every few years with a tripod-mounted antenna, then estimating the velocity from the campaign positions. It is cheaper than a permanent station and was the main way crustal motion was measured in the 1990s, but each campaign carries setup errors of a millimeter or more, and many years are needed. Coulee Geomatics' dam monitoring pillars, with their forced-centering plates, are effectively campaign sites observed monthly, which is why the university group is interested in their record.
Plate-fixed coordinates
A global frame lets everything move, which is right for science but awkward for property surveys and engineering. If a pipeline's coordinates change by 18 mm every year, its as-built drawings drift away from reality. National frames in Canada and the United States therefore remove the rotation of the North American plate, so that monuments on the stable part of the plate keep nearly fixed coordinates. In such a plate-fixed frame, a station's velocity is just the residual after rotation is removed: zero, plus GIA, plus any boundary deformation.
NATRF2022 does this by removing the rotation of the North American plate from ITRF2020 with an Euler pole estimated by the National Geodetic Survey, and an intra-frame velocity model describes the remaining motions, as lessons 9 and 10 explain. In NATRF2022, CR1's velocity is small: a millimeter or so horizontally and about a millimeter per year downward, which is consistent with its position south of the former ice margin.
Worked problem
Speed at a given angular distance from the pole
A plate rotates at 0.19° per million years. How fast does a point 80° from the Euler pole move?
Show solution
- \[\omega = 0.19 \times \frac{\pi}{180} \times 10^{-6} = 3.32 \times 10^{-9}\ \text{rad/yr}\]
- \[v = \omega\,R \sin 80^\circ = 3.32 \times 10^{-9} \times 6\,371\,000 \times 0.985 = 0.0208\ \text{m/yr}\]
Answer: About 21 mm per year.
Estimating an Euler vector from velocities
Given velocities at several stations on the stable part of a plate, the Euler vector can be estimated by least squares. Each station contributes two equations, east and north, that are linear in the three components of ω. With dozens of stations the problem is well determined, and the residuals show where the plate is not rigid. The choice of stations matters: stations near boundaries, in areas of strong GIA or with short records bias the result. Agencies therefore select a core set of stations, test the residuals, and iterate. The same estimation, with the same pitfalls, appears whenever a national frame is defined as fixed to a plate.
Errors in an Euler vector grow with time in a plate-fixed frame. An error of only 0.01 milliarcseconds per year in the rotation rate produces about 0.3 mm per year of apparent motion at the surface, which accumulates to 3 mm over a decade. That is small for most work but not for national frames that are meant to last decades, and it is one reason why frames are re-estimated and their velocity models updated.
Coulee Geomatics: what the district should expect
Leah's first briefing note for the district is short. In the global frame, CR1 moves about 18 mm per year to the south-west; in the national frame, it barely moves at all. Both statements are true. District staff who download coordinates from a precise point positioning service and compare them with published national coordinates will see a difference of more than a meter, not because either is wrong, but because they are in different frames. The firm's job is to make sure the district always knows which frame and epoch each number is in.
Common mistakes
MistakeThinking a station in the national frame is not moving at all.
InsteadIt has small residual velocities from GIA, boundary deformation and local effects.
MistakeUsing a geological plate model for millimeter-level work.
InsteadUse a geodetic model consistent with the frame being used.
MistakeEstimating an Euler vector from stations near plate boundaries.
InsteadUse stable interior stations and test the residuals.
MistakeAssuming plate velocities are the same direction everywhere on a plate.
InsteadDirections vary across a plate because the motion is a rotation about a pole.
Summary and key terms
- Plates move as rigid caps rotating about Euler poles; v = ω × r.
- North America moves about 15 to 20 mm per year roughly west-south-west in ITRF2020.
- Measured velocities also include boundary deformation, GIA, local motion and noise.
- Glacial isostatic adjustment raises the land around Hudson Bay by about a centimeter per year.
- National frames remove plate rotation so that monuments keep nearly fixed coordinates.
- Euler vectors are estimated from velocities at stable stations by least squares.
- Euler pole
- The point where a plate's rotation axis meets the Earth's surface.
- Euler vector
- A vector along the rotation axis whose length is the plate's angular velocity.
- Plate-fixed frame
- A frame in which the rotation of a chosen plate has been removed.
- GIA
- Glacial isostatic adjustment: the continuing response of the Earth to the melting of ice sheets.
- Peripheral bulge
- The ring of crust raised beyond an ice sheet's edge, which subsides after the ice melts.
- Subduction zone
- A plate boundary where one plate descends beneath another.
Practice problems
Work each problem on paper first, then reveal the answer to check.
Where on a plate is the velocity zero?
Show answer
At the Euler pole.
Why do velocities in Halifax and Prince Rupert point in different directions?
Show answer
The motion is a rotation about a distant pole, so its direction varies across the plate.
What causes uplift of about 1 cm per year around Hudson Bay?
Show answer
Glacial isostatic adjustment after the Laurentide ice sheet melted.
An Euler vector error of 0.01 mas per year causes about how much apparent motion over 20 years?
Show answer
About 0.3 mm per year × 20 = 6 mm.
Why do national frames remove plate rotation?
Show answer
So that coordinates of monuments on the stable plate change very little with time.
Lesson quiz · 5 questions
Score 60% or more to complete this lesson.
Create a free account to save your progress, take quizzes and earn a certificate.