
GEOM-430 · Lesson 12 of 12 · 21 min
Geodesy and climate
Geodesy measures the shape, orientation and gravity of the Earth and how they change. Most of the changes this course has met so far are slow and natural: plates drifting, the crust rebounding from the last ice age, faults loading and slipping. In the last few decades, geodesy has become one of the main ways of measuring a faster change, the response of the planet to a warming climate. Melting ice, rising seas, shifting water and even the wobble of the Earth's axis all show up in geodetic data. This final lesson brings the threads together, and closes Coulee Geomatics' year of work with a briefing to the district.
Why geodesy measures climate
A warming climate moves mass and energy. Ice on land melts and flows into the ocean; the ocean warms and expands; water is redistributed between the land, the atmosphere and the sea. Each of these changes alters the shape of the sea surface, the height of the land, the gravity field and the rotation of the Earth. Geodetic techniques measure all four. The international program that coordinates climate observations lists several geodetic quantities among its essential climate variables, including sea level, ice sheet mass change and terrestrial water storage, and the reference frame underpins all of them.
The demands are severe. A sea level rise of 3 to 4 mm per year must be measured to a fraction of a millimeter per year over decades, from satellites whose orbits are computed in the ITRF. An error of 0.5 mm per year in the frame's origin along the polar axis would bias the measured rise at high latitudes and the estimated melting of the ice sheets. That is why the Global Geodetic Observing System sets its goal of 0.1 mm per year for frame stability, and why the United Nations adopted a resolution in 2015 calling on countries to share data and sustain the global geodetic reference frame.
Ice sheets and glaciers
Three geodetic methods measure the mass of the ice sheets. Satellite gravimetry, from GRACE and GRACE-FO, measures the change of mass directly. Altimetry, from laser and radar satellites such as ICESat-2 and CryoSat-2, measures the change of surface height, which is turned into mass with assumptions about the density of snow and firn. And the input-output method compares the snowfall, from climate models, with the flow of ice into the sea, measured with satellite radar interferometry and GNSS on the ice. International assessments that combine all three find good agreement.
| Ice body | Approximate mass change | Sea level equivalent |
|---|---|---|
| Greenland ice sheet | about −270 Gt per year since 2002 | about 0.75 mm per year |
| Antarctic ice sheet | about −150 Gt per year since 2002 | about 0.4 mm per year |
| Glaciers outside the ice sheets | about −270 Gt per year since 2000 | about 0.75 mm per year |
All three numbers vary strongly from year to year with the weather: a warm summer in Greenland can more than double its loss, and a snowy year in Antarctica can offset much of a decade's trend there. GRACE showed this variability for the first time. It also showed where the loss happens. In Greenland it is mostly around the margins, from melting at the surface and from fast-flowing outlet glaciers; in Antarctica, it is concentrated in West Antarctica, where warm ocean water erodes glaciers from below, while parts of East Antarctica gain a little mass.
Alaska's glaciers are among the largest contributors outside the ice sheets. Their retreat is measured by GRACE, by airborne and satellite altimetry, and by long-term mass balance measurements on reference glaciers maintained by the US Geological Survey. In the northern Rockies, including Glacier National Park north-west of Great Falls, the loss of glaciers matters directly for river flow in late summer, when irrigation demand is highest.
The sea level budget
Lesson 7 showed that global mean sea level has risen by about 11 cm since 1993. Geodesy and oceanography together can explain that rise as a budget: the sum of the contributions should equal the observed rise. Thermal expansion of the warming ocean, measured by thousands of profiling floats of the Argo program since the mid-2000s, accounts for roughly 40 percent. The rest is added water: from glaciers, the two ice sheets and changes in water stored on land. The code totals approximate contributions and compares them with the altimetry rate.
# Sea level budget and ice mass loss expressed as sea level equivalent.
GT_PER_MM = 362.0                     # gigatonnes of water that raise global mean sea level by 1 mm
ice = [("Greenland ice sheet", -270), ("Antarctic ice sheet", -150), ("glaciers outside the ice sheets", -270)]
total_ice = 0.0
for name, gt in ice:
    sle = -gt / GT_PER_MM; total_ice += sle
    print(f"{name:32s} {gt:+5d} Gt/yr -> {sle:+.2f} mm/yr")
thermo = 1.3                          # thermal expansion, mm/yr (approximate)
land = 0.2                            # land water storage, mm/yr (approximate)
budget = total_ice + thermo + land
print(f"thermal expansion                {thermo:+.2f} mm/yr")
print(f"land water storage               {land:+.2f} mm/yr")
print(f"sum of contributions             {budget:+.2f} mm/yr")
obs = 3.3
print(f"altimetry average since 1993     {obs:+.2f} mm/yr; residual {obs - budget:+.2f} mm/yr")
# Capstone check: what happens to the district's control point when the national frames change?
for item, value in [("NAD83(2011) to NATRF2022 at CR1", "about 1.4 m horizontal"), ("NAVD 88 to NAPGD2022 at CR1", "about 0.3 to 1 m (check the release)"), ("NATRF2022 vs ITRF2020 at 2026.84", "about 12 cm")]:
print(f"{item:40s} {value}")Greenland ice sheet -270 Gt/yr -> +0.75 mm/yr Antarctic ice sheet -150 Gt/yr -> +0.41 mm/yr glaciers outside the ice sheets -270 Gt/yr -> +0.75 mm/yr thermal expansion +1.30 mm/yr land water storage +0.20 mm/yr sum of contributions +3.41 mm/yr altimetry average since 1993 +3.30 mm/yr; residual -0.11 mm/yr NAD83(2011) to NATRF2022 at CR1 about 1.4 m horizontal NAVD 88 to NAPGD2022 at CR1 about 0.3 to 1 m (check the release) NATRF2022 vs ITRF2020 at 2026.84 about 12 cm
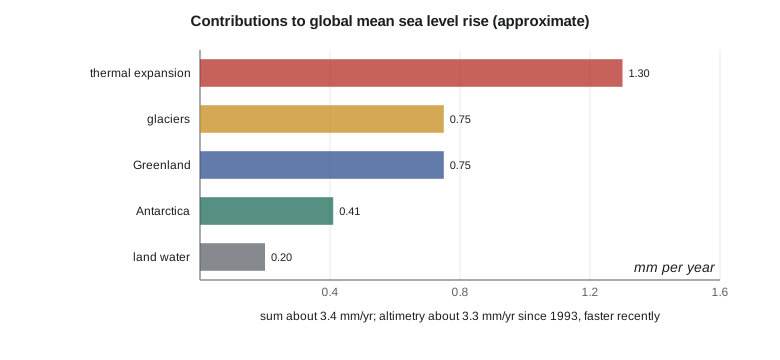
With the approximate values, the contributions sum to about 3.4 mm per year, compared with about 3.3 mm per year from altimetry averaged since 1993. The residual of about 0.1 mm per year is well within the uncertainties of each term. The budget does not close perfectly in every year, but over decades it does, which gives confidence that the major processes are understood. Because the recent rate has risen to about 4.5 mm per year, the contributions in the last decade are larger than these long-term averages, particularly from Greenland and from thermal expansion.
Water on land
GRACE has also measured large changes in water stored on land: depletion of aquifers where groundwater is pumped faster than it recharges, as lesson 5 described, and changes in soil moisture, snow and lakes with droughts and wet years. Over the whole planet, these changes almost balance in some years and add or remove a few tenths of a millimeter per year of sea level in others. El Niño years, when heavy rain falls over the ocean and land dries, show a temporary rise in sea level of several millimeters, followed by a fall when the pattern reverses. The geodetic record lets scientists separate these short swings from the long-term trend.
The Earth's rotation and climate
Moving mass also changes the Earth's rotation. When ice melts at high latitudes and the water spreads across the ocean, mass moves toward the equator and the Earth's moment of inertia increases, which slows the rotation slightly and lengthens the day. Studies of the length of day and of the drift of the rotation pole over the last few decades have found that the melting of the ice sheets, glaciers and changes in groundwater have measurably affected both. The direction of the long-term drift of the pole changed around the turn of the century, which studies have linked to the redistribution of water and ice. The effects are tiny, milliseconds and milliarcseconds, but they are measured by VLBI and GNSS, and they provide an independent check on the mass changes seen by GRACE.
Reference frames for a changing planet
Every one of these measurements depends on the reference frame. Altimetry orbits are computed in the ITRF; GRACE fields need the degree-one terms, which describe the motion of the Earth's center of mass relative to the crust, from SLR; GNSS vertical velocities at tide gauges and on ice depend on the frame's origin and scale; and the comparison of tide gauges with altimetry depends on both. As the climate signals grow, so does the need for a frame that is stable to a tenth of a millimeter per year. The new VLBI antennas, more SLR stations, better local ties and missions such as Genesis are, in large part, investments in measuring climate change.
National frames are part of this too. Each continuously operating station a country contributes to the global network, and each local tie it measures, improves the frame for everyone. Canada and the United States contribute stations, VLBI and SLR facilities (mainly in the United States), analysis centers and local ties, and both participate in the international services. A station such as CR1, small as it is, adds to that network once it is accepted.
Capstone: Coulee Geomatics' briefing to the district
At the end of the year, Leah presents a briefing to the irrigation district's board. It is meant for engineers and managers, not geodesists, so it answers practical questions. Ruth reviews it, and Theo prepares the numbers. The summary table, also produced by the code, shows what changes at CR1.
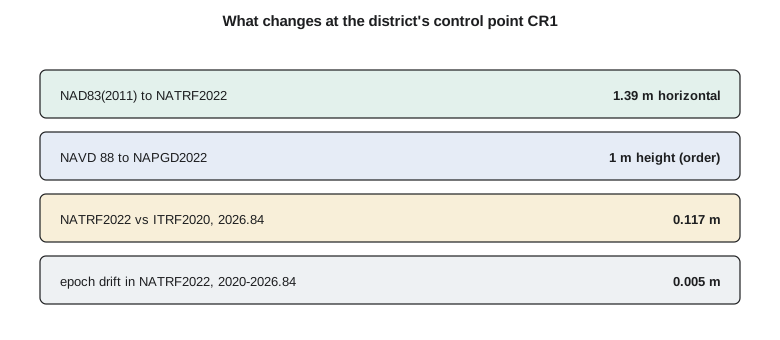
The briefing makes five points. First, CR1 has been accepted into the NOAA CORS Network and now contributes to the national frame; its official coordinates come from NGS. Second, the district's coordinates are in NAD83(2011) epoch 2010.00, and when NATRF2022 is released they will change by about 1.4 m horizontally at CR1, with State Plane coordinates changing to SPCS2022; the firm will convert the district's records with the NGS tools. Third, the district's heights are in NAVD 88, and in NAPGD2022 they will change by several decimeters to about a meter, nearly uniformly across the district, so height differences within projects will barely change. Fourth, the ground at CR1 sinks by about a millimeter per year, which matters only for the most precise drainage work and for comparisons with surveys decades old. Fifth, the loss of glaciers in the northern Rockies and the variability seen by GRACE in the region's water storage are relevant to the district's long-term water planning, and the firm recommends that the district follow the state and federal hydrological assessments that use them.
The board's questions are practical. Will the canal stop working when the coordinates change? No: the ground has not moved, only the numbers describing it. Do the old drawings become useless? No, but every coordinate on them must be labeled with its frame and datum, and conversions must be done with official tools, not by adding a constant. Should the district pay for more continuous stations? One at each end of the system would strengthen its monitoring and the national network, and the firm offers to prepare a proposal. The board's last question is whether all this will happen again. Leah answers honestly: yes. Frames will be refined, models updated and datums realized anew, and each time the firm will tell the district what changed and why.
Worked problem
Converting ice loss to sea level
In a warm year, Greenland loses 450 Gt of ice. How much does that add to global mean sea level that year?
Show solution
- \[\Delta h = \frac{450}{362} = 1.24\ \text{mm}\]
Answer: About 1.2 mm, roughly a third of a typical year's total rise.
Looking ahead
The next decade will bring a new generation of gravity missions, new altimeters, the completion of the modernized national frames and height systems in both countries, yearly ITRF updates and, eventually, a new ITRF. For surveyors, the lesson of this course is that coordinates and heights are measurements of a moving, changing planet. They are only as good as the frame they are expressed in and the epoch they refer to, and the profession's responsibility is to label them, convert them correctly and explain them to the people who use them.
Common mistakes
MistakeThinking climate measurements do not depend on the reference frame.
InsteadFrame origin and scale errors bias sea level and ice mass estimates.
MistakeReading one year's ice loss as the trend.
InsteadYear-to-year variability is large; use multi-year averages.
MistakeAssuming a coordinate change means the ground moved.
InsteadFrame and datum changes alter the numbers, not the ground.
MistakeConverting between frames or datums by a constant shift.
InsteadUse the official transformation tools, which vary with location and time.
Summary and key terms
- Geodesy measures climate change through sea level, ice mass, water storage and Earth rotation.
- Greenland, Antarctica and glaciers lose hundreds of gigatonnes of ice per year; 362 Gt raises sea level 1 mm.
- The sea level budget: thermal expansion plus added water roughly equals the observed rise.
- Mass redistribution changes the length of day and the motion of the pole.
- A frame stable to 0.1 mm per year is needed to measure these signals reliably.
- Surveyors must label, convert and explain coordinates as frames and datums change.
- Essential climate variable
- A quantity that must be observed systematically to characterize the climate.
- Sea level budget
- The comparison of the observed sea level rise with the sum of its contributions.
- Thermal expansion
- The increase in ocean volume as seawater warms.
- Input-output method
- Estimating ice sheet mass change from snowfall minus ice discharge.
- Sea level equivalent
- The global sea level rise that a given mass of water would cause.
- GGOS
- The Global Geodetic Observing System of the International Association of Geodesy.
Practice problems
Work each problem on paper first, then reveal the answer to check.
Convert an ice loss of 181 Gt to sea level.
Show answer
About 0.5 mm.
What fraction of recent sea level rise comes from thermal expansion?
Show answer
Roughly 40 percent.
Why does melting polar ice lengthen the day?
Show answer
Mass moves toward the equator, increasing the Earth's moment of inertia.
Which technique provides the degree-one terms GRACE needs?
Show answer
SLR.
Why should a district label every coordinate with its frame and epoch?
Show answer
So that it can be converted and checked as frames and datums change.
Lesson quiz · 5 questions
Score 60% or more to complete this lesson.
Create a free account to save your progress, take quizzes and earn a certificate.