
GEOM-430 · Lesson 2 of 12 · 21 min
ITRF and its realizations
The International Terrestrial Reference Frame is the backbone of every modern coordinate in Canada and the United States, whether or not the user ever sees it. National frames are tied to it, GNSS orbits are expressed in it, and the precise point positioning services of GEOM-300 deliver it directly. This lesson looks at how an ITRF is made, what its numbers mean, and how successive realizations relate to each other.
A frame made of stations and velocities
An ITRF is a list. For each of more than a thousand sites around the world it gives coordinates at a reference epoch and a velocity, so that a station's position at any time t can be found from its position at the epoch t₀. Since ITRF2014, the frame has also included models for post-seismic deformation at stations affected by large earthquakes, and ITRF2020 added models of annual and semi-annual motions for many stations. The result is closer to a trajectory model for each station than to a fixed coordinate list.
For ITRF2020 the reference epoch is 2015.0. The velocities are about 1 to 10 cm per year almost everywhere, dominated by plate motion, so a station's coordinates at the epoch of a survey in late 2026 differ from its tabulated coordinates by tens of centimeters. Forgetting to propagate is one of the commonest mistakes in high-precision work.
Four techniques, combined
No single measurement technique can define a terrestrial frame on its own. The ITRF combines solutions from four space geodetic techniques, each analyzed by the international services of the International Association of Geodesy: very long baseline interferometry (VLBI), satellite laser ranging (SLR), GNSS and DORIS. Each technique contributes what it measures best. SLR is the most sensitive to the Earth's center of mass and so defines the origin. VLBI and SLR together define the scale. GNSS provides a dense global network and ties everything to the positions users actually reach. DORIS gives a well-distributed network of beacons, many on remote islands.
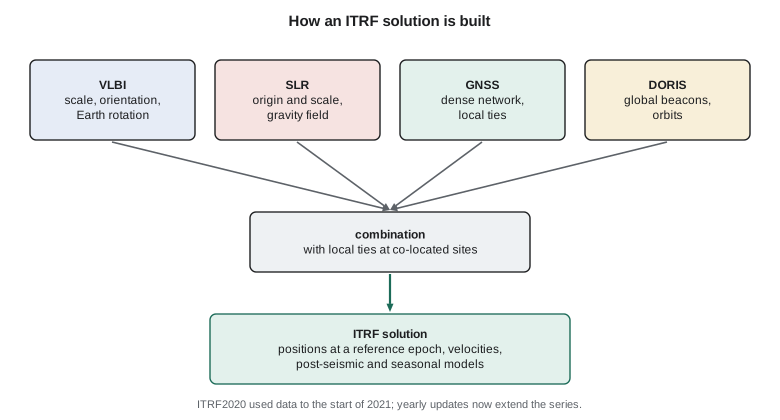
The techniques are connected at co-located sites, where two or more instruments sit near each other. The vectors between their reference points, called local ties, are measured by conventional surveying: precise total station networks, leveling and GNSS. Local ties are among the most demanding engineering surveys in the world, because they must link, say, the invariant point of a radio telescope that moves as it tracks to the reference point of a GNSS antenna to a millimeter, and errors in them feed straight into the combined frame. Surveying firms and national agencies, including those in Canada and the United States, have contributed such ties.
| Defining element | How ITRF2020 sets it |
|---|---|
| Origin | From SLR: the long-term mean center of mass of the Earth |
| Scale | The average of VLBI and SLR scales |
| Orientation | Aligned to ITRF2014 at epoch 2015.0 using a set of stable core stations |
| Orientation rate | No net rotation of the crust, applied through alignment to ITRF2014 |
Realizations over time
The first ITRF was published in 1988. Each later realization used more data, more stations and better models, and the differences between them shrank from decimeters to millimeters. ITRF2000, ITRF2005, ITRF2008, ITRF2014 and ITRF2020 are the ones most often met today. ITRF2020 used observations up to the start of 2021 and was published in 2022. Since then the IERS center responsible for the frame has started yearly updates that extend the station trajectories and Earth orientation series with new data; the second of these, ITRF2020-u2024, added observations from 2021 to 2025 and was announced in September 2025. The updates keep the same definition as ITRF2020, so they improve positions and velocities of stations without changing the frame itself.
The international GNSS service publishes its own GNSS-only frames aligned to each ITRF, such as IGS20 for ITRF2020, and precise orbits and clocks are produced in them. For most users, a position computed with IGS20 products is in ITRF2020 to within a few millimeters.
Transforming between realizations
Because each ITRF is a slightly different realization of the same system, coordinates in one can be turned into another with a similarity transformation of the kind met in GEOM-230 and GEOM-340. Between ITRF realizations, the parameters are small and they change with time, so fourteen parameters are used: three translations, a scale and three rotations, plus their rates of change.
The IERS publishes the parameters from ITRF2020 to every earlier ITRF. The ones from ITRF2020 to ITRF2014 are tiny: translations of one or two millimeters, a scale difference of a fraction of a part per billion, no rotation, and small translation rates. The code applies values of that size to CR1. The convention for the sign of the rotations is the one the IERS uses; other agencies sometimes use the opposite, and a wrong sign is a classic error that doubles the effect instead of removing it.
import math
# Transform a station from ITRF2020 to ITRF2014 with 14 parameters (values approximately as published by the IERS).
T = (-1.4, -0.9, 1.4)      # translations, mm, at epoch 2015.0
D = -0.42                  # scale, parts per billion
R = (0.0, 0.0, 0.0)        # rotations, milliarcseconds
Tr = (0.0, -0.1, 0.2)      # translation rates, mm/yr
Dr = 0.0; Rr = (0.0, 0.0, 0.0)
t0 = 2015.0
def geod2ecef(lat, lon, h, a=6378137.0, f=1 / 298.257222101):
    e2 = f * (2 - f); la, lo = math.radians(lat), math.radians(lon)
    N = a / math.sqrt(1 - e2 * math.sin(la) ** 2)
    return ((N + h) * math.cos(la) * math.cos(lo), (N + h) * math.cos(la) * math.sin(lo), (N * (1 - e2) + h) * math.sin(la))
lat, lon, h = 47.506004222, -111.297790917, 1004.826
X = geod2ecef(lat, lon, h)
t = 2026.84
mas = math.radians(1 / 3.6e6)
Tt = [(T[i] + Tr[i] * (t - t0)) / 1000 for i in range(3)]
Dt = (D + Dr * (t - t0)) * 1e-9
Rt = [(R[i] + Rr[i] * (t - t0)) * mas for i in range(3)]
x, y, z = X
X2 = (x + Tt[0] + Dt * x - Rt[2] * y + Rt[1] * z,
      y + Tt[1] + Rt[2] * x + Dt * y - Rt[0] * z,
      z + Tt[2] - Rt[1] * x + Rt[0] * y + Dt * z)
print("ITRF2020 X Y Z (m)", " ".join(f"{v:.4f}" for v in X))
print("ITRF2014 X Y Z (m)", " ".join(f"{v:.4f}" for v in X2))
dx = [1000 * (b - a) for a, b in zip(X, X2)]
print("change (mm)       ", " ".join(f"{v:+.1f}" for v in dx))
la, lo = math.radians(lat), math.radians(lon)
e = -math.sin(lo) * dx[0] + math.cos(lo) * dx[1]
n = -math.sin(la) * math.cos(lo) * dx[0] - math.sin(la) * math.sin(lo) * dx[1] + math.cos(la) * dx[2]
u = math.cos(la) * math.cos(lo) * dx[0] + math.cos(la) * math.sin(lo) * dx[1] + math.sin(la) * dx[2]
print(f"local change east {e:+.1f} north {n:+.1f} up {u:+.1f} mm")ITRF2020 X Y Z (m) -1568020.4615 -4022222.7303 4680689.6191 ITRF2014 X Y Z (m) -1568020.4622 -4022222.7307 4680689.6209 change (mm) -0.7 -0.4 +1.8 local change east -0.5 north +0.7 up +1.8 mm
At epoch 2026.84 the transformation moves CR1 by under 2 mm in each local component, almost all of it upward from the translation along Z and the scale. Between earlier pairs of realizations the changes are larger: from ITRF2008 to ITRF2014 or from ITRF2000 to the later frames, centimeters in places. But the important message is the order of magnitude. Between modern ITRF realizations the differences are millimeters, while the change in a station's position from one year to the next is centimeters. Getting the epoch right matters far more than choosing between ITRF2014 and ITRF2020.
Worked problem
Propagating to the epoch of observation
A station's ITRF2020 coordinates at epoch 2015.0 have a velocity of 17.6 mm per year to the south-west. How far does it move by epoch 2026.84?
Show solution
- \[\Delta t = 2026.84 - 2015.0 = 11.84\ \text{yr}\]
- \[d = 17.6 \times 11.84 = 208\ \text{mm}\]
Answer: About 0.21 m. Coordinates used at the wrong epoch would be wrong by that much.
Quality and what limits it
The internal precision of ITRF2020 at well-observed stations is a few millimeters in position and a fraction of a millimeter per year in velocity. Its accuracy is limited by the agreement between techniques. The scales from VLBI and SLR still differ slightly, and the origin is affected by how well SLR stations are distributed, with fewer of them in the southern hemisphere. The goals of the Global Geodetic Observing System, an IAG program, are a frame accurate to 1 mm and stable to 0.1 mm per year, which are needed for measuring sea level rise and other slow changes of the planet. Reaching them depends on new VLBI antennas, more SLR stations and better local ties.
There is also the question of what happens to a station between realizations. Earthquakes, antenna changes and slow non-linear motions cause discontinuities. Each realization deals with them by splitting a station's history into segments, each with its own position and velocity, and by modeling the decaying motion after large earthquakes. Users who take coordinates from an ITRF file must check which segment applies at their epoch.
Reading a frame solution
ITRF solutions are distributed in the Solution Independent Exchange format, SINEX, a text format shared by all the geodetic services. A SINEX file contains, for each station and each solution segment, the estimated position and velocity, the epoch, and their full covariance matrix. It also lists the antenna, the eccentricity of its reference point from the monument, and the periods during which each segment is valid. Most users never open one: they take coordinates from a national agency, a processing service or a web tool. But anyone who adopts a station as control for a precise project should look at the file, or at the agency's station page built from it, and check three things. Is there a discontinuity between the reference epoch and the epoch of the survey? Is the antenna the same one? And is the velocity estimated from a long enough span to be reliable?
The length of the record matters. A velocity estimated from two years of data can be biased by seasonal motions and by correlated noise, because GNSS position time series are not white noise: they wander slowly, in a pattern often called flicker or random-walk noise. Experience from global networks suggests that at least three, and preferably five or more, years of continuous data are needed before a velocity is good to a fraction of a millimeter per year. New stations, including CR1, are therefore given provisional velocities from a model or from nearby stations until their own record is long enough.
Seasonal motions are typically a few millimeters in height and smaller horizontally. They come from loading by the atmosphere, snow, soil moisture and groundwater, and from thermal expansion of the monument and the bedrock. In southern prairie country the snow load of a dry winter is small, but the spring melt and the summer drying of soils still produce an annual vertical cycle of a few millimeters. ITRF2020's seasonal models capture the average cycle for many stations; the remaining year-to-year differences are part of the noise.
Coulee Geomatics and the global frame
Leah's first task is to prepare CR1 for submission to the NOAA CORS Network. Once accepted, the station's daily data will be processed by the National Geodetic Survey with those of the national network and the international frame. Its coordinates and velocity will be estimated in ITRF2020, through the IGS20 products, and, once the modernized system is released, published in NATRF2022, as lesson 10 describes. To be useful, the station needs a monument that does not move, an antenna that never changes without being recorded, and a record of its site, including the local tie between the antenna reference point and the pillar's survey mark.
Theo computes the local tie with a short network of total station and leveling observations from two nearby marks, and writes the eccentricity into the site log: the antenna reference point is 0.1500 m above the forced-centering plate, with zero horizontal offset. That number will be applied to every coordinate ever published for CR1, and Ruth checks it independently.
Common mistakes
MistakeUsing tabulated ITRF coordinates without propagating to the epoch of the survey.
InsteadApply the velocity from the reference epoch to the epoch of observation.
MistakeApplying a transformation's rotations with the wrong sign convention.
InsteadCheck the convention of the published parameters before using them.
MistakeAssuming coordinates differ greatly between ITRF2014 and ITRF2020.
InsteadThey differ by millimeters; epoch errors are far larger.
MistakeIgnoring a station's discontinuities.
InsteadUse the solution segment that covers the epoch of interest.
Summary and key terms
- An ITRF lists station positions at a reference epoch, velocities and, since 2014, post-seismic and seasonal models.
- VLBI, SLR, GNSS and DORIS are combined at co-located sites through surveyed local ties.
- SLR defines the origin; VLBI and SLR together define the scale.
- ITRF2020 has reference epoch 2015.0 and is now updated yearly with new data.
- Fourteen parameters, with rates, transform between realizations.
- Between modern realizations the differences are millimeters; plate motion is centimeters per year.
- Reference epoch
- The moment at which a frame's tabulated coordinates apply.
- Local tie
- A surveyed vector between the reference points of instruments at a co-located site.
- Co-located site
- A site with instruments of two or more space geodetic techniques.
- IGS20
- The GNSS-based frame of the International GNSS Service aligned to ITRF2020.
- Post-seismic deformation
- Slow, decaying motion of the ground after a large earthquake.
- GGOS
- The Global Geodetic Observing System, the IAG program coordinating geodetic observations.
Practice problems
Work each problem on paper first, then reveal the answer to check.
Which technique is most sensitive to the Earth's center of mass?
Show answer
SLR.
A station moves 12 mm per year east. Its coordinates are used at epoch 2015.0 for a survey in 2027.0. What is the error?
Show answer
12 × 12 = 144 mm in the east.
Why are local ties critical to the ITRF?
Show answer
They connect the techniques; errors in them enter the combined frame directly.
How many parameters does a time-dependent similarity transformation have?
Show answer
Fourteen: seven parameters and their rates.
What did the ITRF2020 updates add?
Show answer
Newer observations extending station trajectories and Earth orientation series, without changing the frame definition.
Lesson quiz · 5 questions
Score 60% or more to complete this lesson.
Create a free account to save your progress, take quizzes and earn a certificate.