
GEOM-350 · Lesson 9 of 12 · 17 min
Building information modeling from scans
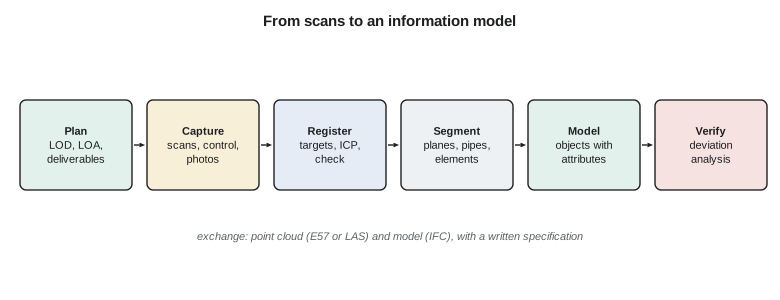
The irrigation project's engineering consultant will design the headworks rehabilitation in building information modeling (BIM) software. They do not want a point cloud; they want a model of objects, piers, deck slabs, gates, hoists and pipes, each with geometry, a type and attributes, that they can use for design, quantities, clash checks and, later, asset management. Converting the registered scans into that model, a process called scan to BIM, is the last stage of the headworks work and the one most likely to go wrong through misunderstanding rather than measurement error. Ines spends as long agreeing the specification with the consultant as Theo spends modeling.
What a building information model is
A building information model represents a facility as a set of objects with geometry and information, rather than as lines on drawings. A wall object knows it is a wall, its material, thickness and fire rating; a pipe knows its diameter, material and system; and drawings, schedules and quantities are generated from the model. The approach began in building design but is now used for bridges, dams, water and wastewater plants and civil infrastructure generally. Models are exchanged between software through the Industry Foundation Classes (IFC), an open schema published by buildingSMART International and standardized as ISO 16739, alongside native formats.
For existing facilities the model must describe what is there now, which is rarely what the original drawings show. Scanning provides the as-built or as-is geometry. Modeling it is mostly manual, assisted by the feature extraction tools of lesson 8: the modeler fits planes to walls and slabs, cylinders to pipes, and places library objects, such as a standard valve or hoist, aligned to the points. Fully automatic scan to BIM remains a research goal; commercial tools automate parts, such as pipe runs, walls in buildings and steel sections, and the rest is skilled work.
Level of development and level of accuracy
Two related ideas define what a model must contain and how well it must match reality. Level of development (LOD), defined in the BIMForum's annual Level of Development Specification, describes how much detail and reliable information an element has, from LOD 100 (a symbol or rough mass) through 200, 300 and 350 (specific size, shape, location and interfaces) to 400 (fabrication detail) and 500 (field-verified). A model for rehabilitation design might need piers and slabs at LOD 300, gates and hoists at LOD 200 with their envelopes, and the pipes that will be replaced at LOD 300 with their connections.
Level of accuracy (LOA), defined in the U.S. Institute of Building Documentation's LOA Specification and widely used in both countries, describes how closely measured or modeled geometry matches reality, as a range of the standard deviation at the 95 percent level:
| Level | Upper range (95 %) | Typical use |
|---|---|---|
| LOA10 | User defined, larger than 50 mm | Rough massing, planning |
| LOA20 | 50 mm | General arrangement, space planning |
| LOA30 | 15 mm | Most architectural and structural as-builts |
| LOA40 | 5 mm | Detailed structural and mechanical work, fit-up |
| LOA50 | 1 mm | Precise industrial and fabrication tolerances |
The specification distinguishes measured accuracy, how well the registered point cloud represents reality, from represented accuracy, how well the model represents the point cloud. A model can never be more accurate than its points, and modeling simplifications, such as treating a slightly bowed slab as flat, add to the error. A good specification states both for each element type: for example, piers measured at LOA40 and modeled at LOA30, because the model represents them as straight prisms while their faces depart from flat by a few millimeters.
In the United States, the National BIM Standard-United States (NBIMS-US) collects practice documents, and owners such as the General Services Administration, whose BIM guide series includes a volume on 3D imaging, set requirements for their projects; many state transportation departments now publish digital delivery standards. The irrigation project has no BIM standard of its own, so Ines and the consultant write a short BIM execution plan for the headworks, naming the LOD and LOA for each element type, the coordinate system (the project's low-distortion projection and NAVD 88 heights), the IFC version and the delivery schedule.
Modeling the headworks
Theo works element by element. The deck slab is modeled from planes fitted to its top and soffit and the lines where they meet the pier faces. Each pier is modeled as an extrusion of a section traced from horizontal slices through the cloud, with its axis and lean recorded as attributes. The radial gates are modeled from library families adjusted to the scanned arms and skin plates, the hoists as envelopes for clearance only, and the pipes in the gate house by slicing and cylinder fitting, with each run's diameter checked against the nominal sizes listed in the 1957 drawings. Where the scans could not see a surface, such as the inside of the trunnion housings, the element is modeled from drawings and flagged as not field-verified, an essential attribute that later users will rely on.
Coordinates matter here as everywhere. BIM software often works best near its local origin and can lose precision with large coordinates, so models are commonly built in a local engineering frame and linked to the project coordinate system by a documented transformation, with a survey point and project base point marked in the model. Ines insists on the low-distortion projection for this project, so that model distances equal ground distances (lesson 2), and records the transformation from the model's local origin to project coordinates in the execution plan.
Deviation analysis and verification
Verification compares the model with the point cloud and the point cloud with control. A deviation analysis computes the distance from each point to the nearest model surface and displays it as a color map, revealing where the model departs from reality: bowed slabs, leaning walls, bulges and spalls. The same analysis compares the as-built condition with the original design, which is what the engineers most want to see.
import math, random
random.seed(9)
# As-built check of the headworks gate deck slab against the 1957 design drawings
design_z = 1010.0 + 4.880                  # design top of slab elevation
# 'scan' heights on a 1 m grid over a 6 m x 20 m bay: settlement toward the downstream end plus wear
grid = {(i, j): design_z - 0.0021 * j - 0.004 * math.exp(-((i - 3) ** 2 + (j - 14) ** 2) / 6) + random.gauss(0, 0.002)
        for i in range(7) for j in range(21)}
dev = {k: (v - design_z) * 1000 for k, v in grid.items()}          # mm
vals = sorted(dev.values())
print(f"deviation from design: min {vals[0]:.1f} mm, max {vals[-1]:.1f} mm, mean {sum(vals)/len(vals):.1f} mm")
bands = [(-5, 5), (-15, -5), (-30, -15), (-99, -30)]
for lo, hi in bands:
    n = sum(lo <= v < hi for v in vals)
    print(f"  {lo:4d} to {hi:3d} mm: {n:3d} points ({n/len(vals):.0%})")

# Flatness: the largest gap under a 3 m straightedge along each grid row
worst = 0.0
for i in range(7):
    for j in range(0, 18):
        a, b = grid[(i, j)], grid[(i, j + 3)]
        for m in (1, 2):
            gap = (a + (b - a) * m / 3) - grid[(i, j + m)]
            worst = max(worst, gap)
print(f"largest gap under a 3 m straightedge {worst*1000:.1f} mm")

# Level of accuracy: which band the measured uncertainty supports (USIBD-style LOA ranges, upper limits in mm)
loa = [('LOA50', 1), ('LOA40', 5), ('LOA30', 15), ('LOA20', 50), ('LOA10', 1e9)]
for label, sig in (('registration + scanner, 2 sigma', 2 * math.hypot(1.6, 2.0)), ('total station control, 2 sigma', 2 * 1.2)):
    level = next(l for l, lim in loa if sig <= lim)
    print(f"{label}: {sig:.1f} mm -> {level}")

# Wall verticality from two slices of the pier face: offsets at 0.5 m and 3.5 m above the deck
for name, o_low, o_high in (('pier 2 upstream face', 0.6038, 0.6247), ('pier 3 upstream face', 0.5990, 0.6002)):
    tilt = (o_high - o_low) / 3.0
print(f"{name}: lean {tilt*1000:.1f} mm per m ({math.degrees(math.atan(tilt)):.2f} deg)")deviation from design: min -45.9 mm, max 0.8 mm, mean -21.5 mm
-5 to 5 mm: 21 points (14%)
-15 to -5 mm: 32 points (22%)
-30 to -15 mm: 45 points (31%)
-99 to -30 mm: 49 points (33%)
largest gap under a 3 m straightedge 6.4 mm
registration + scanner, 2 sigma: 5.1 mm -> LOA30
total station control, 2 sigma: 2.4 mm -> LOA40
pier 2 upstream face: lean 7.0 mm per m (0.40 deg)
pier 3 upstream face: lean 0.4 mm per m (0.02 deg)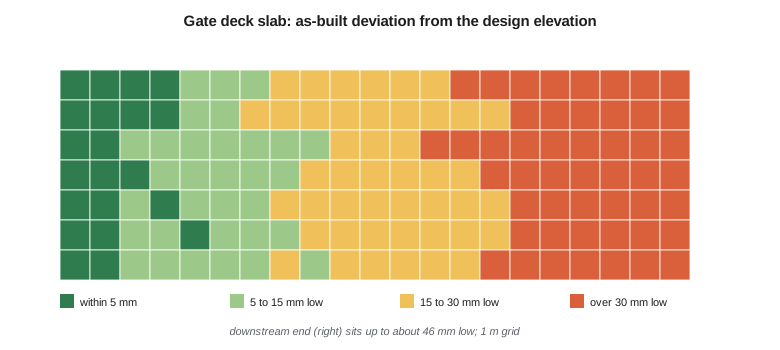
The deck bay sits on average 21.5 mm (0.85 in) below its design elevation and as much as 45.9 mm (1.8 in) low at its downstream end, with a local depression near the middle; only 14 percent of the grid is within 5 mm of the design. The 3 m straightedge test finds a largest gap of 6.4 mm, so the slab is reasonably flat locally even though it has settled as a whole. The uncertainty of the measurement, about 5.1 mm at 95 percent from scanner noise and registration, supports LOA30 for the model; the control traverse itself supports LOA40. The slices show that pier 2's upstream face leans 7.0 mm per meter, 0.40°, consistent with the RANSAC fit of lesson 8, while pier 3 is essentially plumb at 0.4 mm per meter. A settling deck and one leaning pier point the engineers toward a foundation problem under the downstream end of pier 2, and they order a geotechnical investigation before finalizing the design.
Verification also checks the model against independent measurements: a few dimensions taped or measured by total station, such as the clear spans between piers, and the checkpoint targets withheld from registration. Leah's report to the consultant lists each element type with its LOD and LOA as delivered, the deviation statistics, the elements modeled from drawings rather than scans, and the known limitations.
Where scan-to-BIM projects go wrong
Most disputes on scan-to-BIM work are about expectations rather than measurement. A client who imagined every bolt and conduit receives a model at LOD 200; a modeler who straightened every wall to make a tidy model hides exactly the deformation the engineer wanted to see; a model delivered in a local frame with no recorded link to project coordinates cannot be combined with the site survey. Time is the other trap: modeling typically takes several times as long as scanning and registration together, and complex pipework far longer, so budgets built on field days alone fall short. Ines now asks for a small pilot area, one pier and one pipe run, modeled and reviewed with the consultant before the rest proceeds, which settles the level of detail, the treatment of deformation and the naming of elements while changes are still cheap.
Delivering point clouds and models
Deliverables usually include the registered point cloud, in E57 for terrestrial scans or LAS/LAZ, with its coordinate system documented; the model in native format and IFC; deviation reports; and the registration and control report. Point clouds of large facilities can be hundreds of gigabytes, so Ines agrees formats, tiling and delivery media in advance, and provides a decimated version for routine viewing. Web-based viewers now let the district's staff browse the scans, measure distances and see the model overlaid without installing software, which has made the data far more useful to the operators who maintain the structure.
Over the long term the model becomes an asset management tool. Attributes for inspection dates, condition ratings and maintenance history can be attached to each element, and repeated scans every few years can be compared with the model to track deterioration, the same change detection idea that lesson 12 applies to the coulee banks. A model is only useful if it is maintained, so the execution plan names who updates it after the rehabilitation.
Common mistakes
MistakeStarting to model before agreeing LOD and LOA for each element type.
InsteadWrite the specification first; it decides the effort and the result.
MistakeAssuming the model is as accurate as the scanner's specification.
InsteadModel accuracy combines measurement, registration and modeling simplifications.
MistakeModeling hidden parts from drawings without saying so.
InsteadFlag elements and surfaces not verified by scanning.
MistakeBuilding the model at large project coordinates without a documented local origin.
InsteadUse a local engineering origin linked to project coordinates by a recorded transformation.
Summary and key terms
- Scan to BIM converts registered point clouds into models of objects with geometry and attributes, exchanged through IFC.
- Level of development describes how much detail and information elements carry; level of accuracy describes how closely geometry matches reality.
- Measured accuracy (points to reality) and represented accuracy (model to points) are specified separately.
- Modeling combines plane, cylinder and section fitting with library objects; unscanned parts are flagged.
- Deviation analysis compares the model, the design and the point cloud and often reveals the engineering story.
- Deliverables, coordinates and maintenance responsibilities belong in a written execution plan.
- Building information model
- A digital representation of a facility as objects with geometry and information.
- Scan to BIM
- Creating a building information model from point clouds of an existing facility.
- IFC
- Industry Foundation Classes, an open schema for exchanging building information models (ISO 16739).
- Level of development
- A measure of the detail and reliability of information in a model element.
- Level of accuracy
- A band describing how closely measured or modeled geometry matches reality.
- Deviation analysis
- Computing and mapping distances between a point cloud and a model or design.
- BIM execution plan
- A document defining a project's modeling requirements, responsibilities and deliverables.
Practice problems
Work each problem on paper first, then reveal the answer to check.
Measured accuracy is 4 mm and represented accuracy 12 mm (both 95 percent). Which LOA band fits the model?
Show answer
LOA30 (15 mm).
Why might a pier be modeled at LOA30 when it was measured at LOA40?
Show answer
The model simplifies its shape, for example as a straight prism.
What does a deviation map compare?
Show answer
Distances from points to the model or design surface.
Why are BIM models often built near a local origin?
Show answer
To avoid precision problems with large coordinates in the software.
What should be recorded for an element modeled from drawings?
Show answer
That it was not field-verified by scanning.
Lesson quiz · 5 questions
Score 60% or more to complete this lesson.
Create a free account to save your progress, take quizzes and earn a certificate.