
GEOM-330 · Lesson 12 of 12 · 23 min
Web GIS
The last phase of the project put the GIS where people could use it without desktop software: on the office staff's browsers, on the ditch riders' tablets in their trucks, and on a public map where water users and the public could see the canal, the structures and notices of closures. This is web GIS, in which maps and data are served over the internet to browsers and apps. It changes the GIS from a tool used by a few trained people into a service used by many, and it brings questions of performance, security, privacy and accessibility that desktop work rarely raises. This lesson covers the architecture of web GIS, the standards for map and data services, tiles and the Web Mercator projection, mobile and offline field apps, and the rules for publishing data, and it closes with the district's go-live as the capstone of the course.
Architecture
A web GIS has three tiers. The data tier is the spatial database (Lesson 4) and file stores for rasters and tiles. The server tier runs a web server and one or more map or feature servers, which receive requests, query the data, render maps or encode features and return the results. The client tier is the browser or app, which displays maps with a JavaScript mapping library, sends requests as the user pans, zooms and clicks, and shows results. Requests and responses travel over HTTPS, with authentication for anything not public. The same services may feed several clients: the district's feature service for turnouts fed the office web application, the ditch riders' app and, through a filtered public view, the public map.
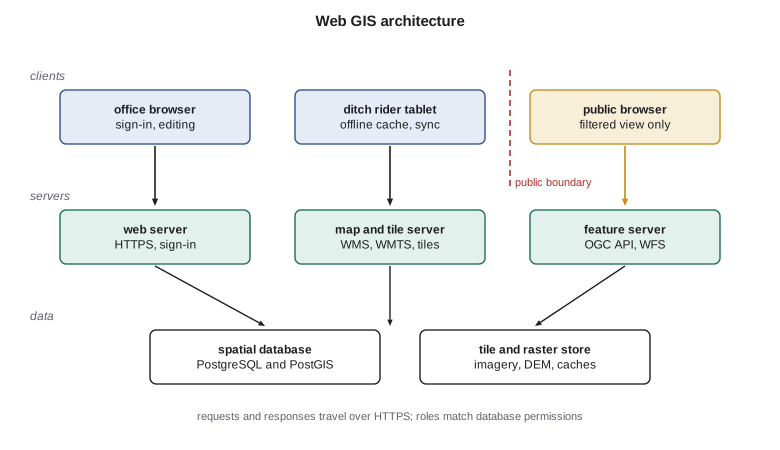
Architectures differ in where the work is done. In server-side rendering the server draws the map as an image and the client only displays it; this works on any device but every pan or zoom requires a new image. In client-side rendering the server sends data, as features or vector tiles, and the client draws them, which allows interactive styling, smooth zooming and rotation but needs a capable client and limits the volume of data. Most modern web maps combine pre-rendered or pre-cut tiles for base maps with feature services for operational layers that change, such as orders and closures.
Service standards
The Open Geospatial Consortium publishes standards that let any compliant client use any compliant server. The Web Map Service (WMS) returns a rendered map image for a requested area, size, CRS and set of layers. The Web Map Tile Service (WMTS) returns pre-rendered tiles from a fixed grid, much faster for base maps. The Web Feature Service (WFS) returns features with their geometry and attributes, in GML or other encodings, and can support editing. The newer OGC API family, including OGC API – Features, OGC API – Tiles and OGC API – Maps, provides the same capabilities with modern web conventions: resources at stable addresses, JSON and GeoJSON encodings, and documentation that developers can read. Commercial platforms also offer their own REST service interfaces, widely supported by clients. Using open standards for public services lets others, such as the county, the province or state and engineering firms, consume the district's data without special software.
Public data in the United States are widely served through these standards. The U.S. Geological Survey's The National Map publishes imagery, elevation and hydrography as map and tile services, and the Montana State Library publishes the MSDI framework layers, including the statewide parcels, as services, so the district's web map could show the latest imagery and parcels as live layers rather than copies.
Tiles and Web Mercator
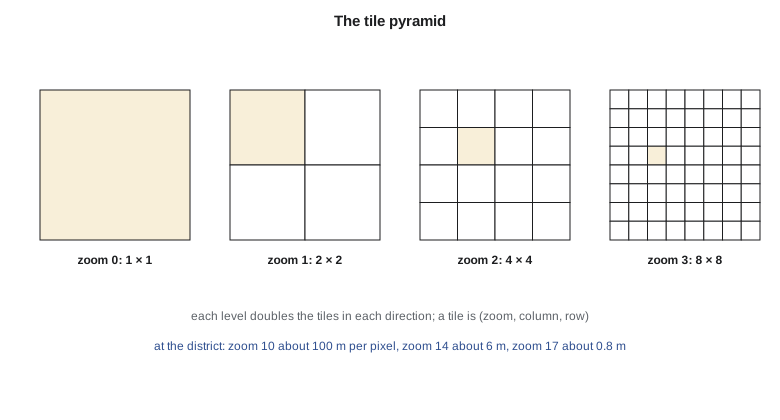
Web base maps are divided into square tiles, usually 256 or 512 pixels, arranged in a pyramid of zoom levels. At zoom 0 a single tile covers the world; each zoom level doubles the number of tiles in each direction, so zoom \(z\) has \(2^z \times 2^z\) tiles and four times the detail of the level before. Tiles are identified by zoom, column and row, so a client can compute which tiles it needs for any view and fetch them in parallel, and servers and browsers can cache them indefinitely. Raster tiles are images; vector tiles contain geometry and attributes clipped to the tile, styled by the client, smaller to transfer and sharp at any screen resolution.
Almost all web tile schemes use the Web Mercator projection, EPSG:3857, which applies the spherical Mercator formulas to WGS 84 longitude and latitude:
with \(R = 6\,378\,137\) m, the WGS 84 semi-major axis. It is conformal, so local shapes and angles are preserved and north is always up, which suits panning and zooming maps of streets. But its scale grows as \(1/\cos\varphi\) with latitude, so areas are exaggerated by \(1/\cos^2\varphi\), and because it uses a sphere for an ellipsoidal datum it is not strictly conformal and is not suitable for measurement. Distances and areas measured on Web Mercator coordinates are wrong by factors of about 1.5 and 2.4 at the district's latitude. Web clients therefore compute measurements geodesically or in a suitable projected CRS, and the district's analyses were always run in its master CRS, with Web Mercator used only for display.
import math
R = 6378137.0                                    # Web Mercator sphere radius (WGS 84 semi-major axis), m
lat, lon = 47.5053, -111.3008                     # district office, WGS 84
def mercator(lat, lon):
    return R * math.radians(lon), R * math.log(math.tan(math.pi / 4 + math.radians(lat) / 2))
def tile(lat, lon, z):
    n = 2 ** z
    x = (lon + 180) / 360 * n
    y = (1 - math.log(math.tan(math.radians(lat)) + 1 / math.cos(math.radians(lat))) / math.pi) / 2 * n
    return int(x), int(y)
X, Y = mercator(lat, lon)
print(f"EPSG:3857 coordinates of the office: x = {X:,.1f} m, y = {Y:,.1f} m")
print(f"Mercator scale factor here 1/cos(lat) = {1 / math.cos(math.radians(lat)):.3f}; areas exaggerated x{1 / math.cos(math.radians(lat)) ** 2:.2f}")
print("\nzoom   tile (x, y)       ground m/pixel   scale at 0.28 mm pixels")
for z in (10, 14, 17, 19):
    res = 2 * math.pi * R / (256 * 2 ** z) * math.cos(math.radians(lat))
    print(f"{z:4d}   {str(tile(lat, lon, z)):16s}  {res:10.3f}       1:{res / 0.00028:,.0f}")

# How many 256 x 256 tiles cover the service area (about 24 km east-west by 16 km north-south) at zooms 10 to 18?
w_km, h_km, total = 24.0, 16.0, 0
for z in range(10, 19):
    span = 2 * math.pi * R * math.cos(math.radians(lat)) / 2 ** z / 1000      # ground km per tile at this latitude
    t = (math.ceil(w_km / span) + 1) * (math.ceil(h_km / span) + 1)
    total += t
    if z in (10, 14, 16, 18): print(f"zoom {z}: about {t:,} tiles")
print(f"zooms 10-18 together: about {total:,} tiles; at about 20 kB each, {total * 20 / 1e6:.1f} GB")EPSG:3857 coordinates of the office: x = -12,389,948.4 m, y = 6,024,945.5 m Mercator scale factor here 1/cos(lat) = 1.480; areas exaggerated x2.19 zoom tile (x, y) ground m/pixel scale at 0.28 mm pixels 10 (195, 358) 103.270 1:368,821 14 (3126, 5728) 6.454 1:23,051 17 (25012, 45830) 0.807 1:2,881 19 (100050, 183321) 0.202 1:720 zoom 10: about 4 tiles zoom 14: about 176 tiles zoom 16: about 2,400 tiles zoom 18: about 36,504 tiles zooms 10-18 together: about 49,140 tiles; at about 20 kB each, 1.0 GB
At the district's latitude a zoom 17 tile pixel covers about 0.81 m of ground, enough to show turnouts and field approaches, and zoom 19 about 0.20 m, close to the resolution of the orthophotos. Caching tiles of the whole service area from zoom 10 to 18 takes about 49,000 tiles, about a gigabyte at a typical tile size, of which three-quarters are at zoom 18 alone. That arithmetic decided the offline strategy for the ditch riders' tablets: each rider cached imagery to zoom 18 only along a 400 m corridor around their laterals, and to zoom 16 elsewhere.
Worked problem
Which tile contains a point?
Find the zoom 14 tile column containing the district office at longitude 111.3008° W.
Show solution
- \[x_{\mathrm{tile}} = \Big\lfloor \frac{\lambda + 180}{360} \times 2^{14} \Big\rfloor = \Big\lfloor \frac{-111.3008 + 180}{360} \times 16\,384 \Big\rfloor\]
- \[\lfloor 0.190831 \times 16\,384 \rfloor = \lfloor 3126.6 \rfloor = 3126\]
Answer: The column matches the code. The row needs the Mercator formula for latitude, and the client repeats both calculations for the corners of the view to list every tile it must fetch.
Mobile and offline field work
The ditch riders' app was the part of the system used most. It showed the laterals, structures, turnouts and fields on cached imagery, the day's orders for each turnout, and forms for recording gate settings, meter readings and problems with photographs, each record automatically located by the tablet's GNSS. Much of the district has poor cellular coverage, so the app worked offline: each morning it downloaded the day's orders and a replica of the rider's area, recorded edits locally during the day and synchronized them with the database when coverage returned. Synchronization is a form of the versioned editing in Lesson 4: conflicts, such as two riders editing the same turnout, were rare but were flagged for the office to resolve rather than silently overwritten. Consumer tablets locate to a few meters, which was enough to find a turnout but not to survey a new one, so new structures were still surveyed by Grant's crew with RTK receivers paired to the tablets.
Security and privacy
Internal services required each user to sign in, with roles that matched the database permissions (Lesson 4), and all traffic used HTTPS. Services were published with only the operations and fields each role needed: the public map's feature service exposed structure type, chainage and closure notices, but not water users, orders or field ownership. Editing services were never exposed publicly. The server, database and software were kept patched, and the district's IT contractor reviewed the configuration before launch.
Publishing data raises privacy questions beyond access control. A map of water use by field identifies each landowner's use to anyone who knows whose field is whose, even without names. Montana's constitution recognizes a right of individual privacy, balanced against the public's right to examine public records, so the district's counsel advised on which records were public and which personal information should be withheld. Leah's rule was that the public map would show only district infrastructure and aggregate statistics, such as irrigated area by crop for the whole district, and that each water user would see their own fields, turnouts and deliveries after signing in. Public data were released with a statement of their accuracy, date and terms of use adopted by the board.
Accessibility
Maps are visual, but public information must be available to people who cannot see the map, who use a keyboard instead of a mouse, or who have low vision or color vision deficiency. The Web Content Accessibility Guidelines (WCAG), published by the World Wide Web Consortium, are the common benchmark, and level AA of version 2.1 is the usual target. For web maps, the main requirements are that the information on the map is also available as text, such as a searchable list of closures with locations described by lateral and chainage and by road; that the map's controls can be operated by keyboard and are labeled for screen readers; that colors meet contrast ratios and meaning does not depend on color alone; and that text can be enlarged without breaking the page.
In the United States, Section 508 of the Rehabilitation Act sets accessibility requirements for federal agencies, and the Department of Justice's 2024 rule under Title II of the Americans with Disabilities Act requires state and local governments' web content and apps to meet WCAG 2.1 AA. An interim final rule published in April 2026 extended the compliance dates to April 2027 for public entities serving 50,000 people or more and April 2028 for smaller ones. As a public body, the district planned to meet the standard ahead of its date, and it tested the public map with a screen reader and keyboard before launch.
Capstone: going live
The district's GIS went live at the start of the irrigation season, eighteen months after Leah's first interviews. Looking back at the needs assessment in Lesson 1, every question on the list could now be answered. The water manager ran a downstream trace for any closure and had the list of affected water users and their phone numbers in a minute (Lessons 4, 6 and 8). Ditch riders found turnouts and the day's orders on their tablets, offline (Lesson 12). The maintenance foreman saw culverts by age and condition, each with its catchment area and a route from the yard (Lessons 5, 8 and 9). The board received a seasonal map of irrigated area and water use by crop, classified with agreed breaks (Lessons 7 and 11). The engineer had a seepage-risk surface built from an interpolated water table, with its uncertainty shown (Lessons 7, 9 and 10). Water users saw their own fields and deliveries online.
| Product | Main data | Main methods | Lesson |
|---|---|---|---|
| Closure notices and affected users | Canal network, turnouts, fields, ownership | Downstream trace, joins | 4, 6, 8 |
| Ditch rider app | Turnouts, orders, cached imagery | Feature services, offline sync | 2, 4, 12 |
| Culvert condition and capacity | Structures, inspections, DEM | Catchments, attribute queries, routing | 5, 8, 9 |
| Seasonal water use map | Fields, remote sensing water use | Zonal statistics, classification | 3, 11 |
| Seepage-risk map | Wells, DEM, soils, reports | Interpolation, weighted overlay | 7, 9, 10 |
| Public map | Network, structures, notices | Filtered services, accessibility | 11, 12 |
Leah's handover report listed what would keep the system healthy: the edit procedures for new and replaced structures, the monthly refresh of public parcel data, the annual check of turnout positions on one lateral in rotation, the metadata review each winter, the backup and restore test each quarter and the training of a second staff member so that the system did not depend on one person. Her last recommendation was the least technical: that the district's staff meeting each spring should review the list of questions the GIS answers and add the new ones, because the questions are what keep a GIS from becoming an expensive map.
Common mistakes
MistakeMeasuring distances or areas in Web Mercator coordinates.
InsteadUse geodesic calculations or the master projected CRS; Web Mercator is for display.
MistakePublishing an internal feature service directly to the public.
InsteadPublish a filtered view with only the fields and operations the public needs.
MistakeCaching every zoom level for the whole area on tablets.
InsteadCache high zooms only where needed; count tiles first.
MistakeTreating the map as the only form of public information.
InsteadProvide the same information as accessible text and test with assistive technology.
MistakeShowing individual water use on a public map.
InsteadPublish aggregates; let each user see their own data after signing in.
Summary and key terms
- Web GIS has data, server and client tiers communicating over HTTPS; rendering may be on the server, the client or both.
- OGC standards (WMS, WMTS, WFS and the OGC API family) let any compliant client use any compliant server.
- Tiles are organized in a pyramid of zoom levels identified by zoom, column and row; vector tiles are styled by the client.
- Web Mercator (EPSG:3857) suits display but exaggerates scale and area with latitude and is unsuitable for measurement.
- Mobile field apps work offline and synchronize edits, with conflicts resolved rather than overwritten.
- Security, privacy and accessibility determine what is published, to whom and in what form.
- A GIS stays useful through procedures, maintenance and a living list of the questions it answers.
- Web GIS
- A GIS whose maps and data are served over the internet to browsers and apps.
- WMS
- The OGC Web Map Service, returning rendered map images.
- WMTS
- The OGC Web Map Tile Service, returning pre-rendered tiles.
- OGC API – Features
- An OGC standard for serving features through modern web interfaces.
- Vector tile
- A tile containing geometry and attributes, styled by the client.
- Web Mercator
- The spherical Mercator projection of WGS 84 coordinates used by web tiles, EPSG:3857.
- Offline synchronization
- Recording edits on a device without a connection and merging them later.
- WCAG
- The Web Content Accessibility Guidelines of the World Wide Web Consortium.
Practice problems
Work each problem on paper first, then reveal the answer to check.
How many tiles are there at zoom 5?
Show answer
2⁵ × 2⁵ = 1,024.
By what factor does Web Mercator exaggerate areas at latitude 60°?
Show answer
1/cos² 60° = 4.
Which OGC service returns features that a client can style and query?
Show answer
WFS or OGC API – Features.
Why are high-zoom tiles the bulk of a cache?
Show answer
Each zoom level has four times as many tiles as the one before.
Name two requirements for making a public web map accessible.
Show answer
The same information available as text; keyboard-operable, labeled controls (also contrast and not relying on color alone).
Lesson quiz · 5 questions
Score 60% or more to complete this lesson.
Create a free account to save your progress, take quizzes and earn a certificate.