
GCP-221 · Lesson 8 of 12 · 19 min
Data Studio reports and dashboards
▶ Video coming soon A video version of this lesson is on the way.
Friday, October 30, is the first visual session. Lena wants a dashboard for the forty store managers, ready for a planned launch on December 1, that answers the questions they ask her every week: how are my sales this week, how does that compare with last year, are returns rising, and which categories are driving the change? Ravi and Mateo build the first version in Data Studio, Google's free reporting tool, and plan the governed version in Looker, covered in lesson 9.
Data Studio, Looker Studio and Looker
Names first, because they confuse everyone. Google's free reporting tool was launched as Data Studio, renamed Looker Studio in 2022, and renamed back to Data Studio on April 10, 2026. The paid tier, formerly Looker Studio Pro, is now Data Studio Pro. Existing reports, data sources and users moved over automatically. Many exam questions, practice tests and articles still say Looker Studio; read them as meaning Data Studio. Looker, without "Studio", is a different product: Google's enterprise business intelligence platform built on a semantic model written in LookML.
| Data Studio | Data Studio Pro | Looker | |
|---|---|---|---|
| Cost | No charge | Per-user subscription | Platform license plus users |
| Best for | Individuals and small teams building reports quickly | Teams needing management, AI features and Google Cloud governance | Organizations needing one governed definition of every metric |
| Where logic lives | In each data source and report | In each data source and report, with team workspaces | In a central LookML model, version-controlled in Git |
| Content ownership | Individual Google accounts | Owned by the organization through team workspaces and projects | The Looker instance |
| Typical Birchline use | Analysts' ad hoc reports | The store manager dashboard | Finance and executive reporting on certified metrics |
The Associate Data Practitioner exam asks you to compare Looker and Looker Studio, now Data Studio, and the comparison comes down to governance. In Data Studio, each report or data source can define metrics its own way, which is fast and flexible but lets definitions drift. In Looker, metrics are defined once in the model and every dashboard inherits them. A practical rule: use Data Studio when speed and flexibility matter and the audience is small or the analysis is exploratory; use Looker when many people across the organization must see the same number defined the same way.
Data sources and connectors
A Data Studio report reads data through a data source, which uses a connector to reach a system such as BigQuery, Google Sheets, Google Ads, Cloud SQL or a file upload. For BigQuery, the data source can point at a table, a view or a custom query. Ravi points it at the shared view curated.v_store_daily from lesson 5, so the dashboard uses the same definition of net sales as every other report.
Two data source settings matter a great deal. The first is data credentials: with owner's credentials, the report queries BigQuery as the person who created the data source, so viewers do not need their own access to the data; with viewer's credentials, each viewer's own BigQuery permissions apply, so they see only what they are allowed to see and their queries are billed to their own project setting. The second is data freshness: Data Studio caches query results for a set period, by default 12 hours for BigQuery, and viewers see cached data until it expires or someone refreshes. A daily dashboard loaded at 06:00 can use a long freshness; an operational dashboard may need 15 minutes.
| Setting | Options | Effect |
|---|---|---|
| Data credentials | Owner's or viewer's | Whose BigQuery access is used; who pays for queries |
| Data freshness | 15 minutes to 12 hours | How long results are cached before BigQuery is queried again |
| Field editing in reports | On or off | Whether report editors can change field definitions |
| Date range dimension | A date field | Which date the report's date controls filter on |
Owner's credentials are convenient, but they turn the data source owner into a gateway to the data: anyone who can view the report sees whatever the source returns. Lesson 10 shows how Birchline combines owner's credentials with a view that limits what is exposed, and when viewer's credentials are the safer choice.
Fields, calculated fields and the ratio trap
Each column in the data source becomes a dimension, something to group or filter by such as region or sale_date, or a metric, something to aggregate such as net_sales. A calculated field adds a new dimension or metric with a formula, either in the data source, where every report using it shares the definition, or in a single chart.
Mateo creates a return rate field and walks straight into the most common calculated-field mistake: averaging ratios. If each row already holds a daily return rate, averaging those rates gives every day equal weight, whatever its sales. The correct return rate for a period is the total returns divided by the total sales, with both sums taken first. In Data Studio that is SUM(refunds) / SUM(net_sales), not AVG(daily_return_rate).
# Daily figures for one store: (net sales, refunds), in dollars
days = [(12000, 480), (11000, 495), (3000, 450), (14000, 560)]

avg_of_ratios = sum(r / s for s, r in days) / len(days)
ratio_of_sums = sum(r for s, r in days) / sum(s for s, r in days)

print(f"Average of daily return rates: {avg_of_ratios:.4f}")
print(f"Total refunds / total sales:   {ratio_of_sums:.4f}")
print(f"Per 100 dollars of sales: {avg_of_ratios * 100:.2f} vs {ratio_of_sums * 100:.2f}")Average of daily return rates: 0.0688 Total refunds / total sales: 0.0496 Per 100 dollars of sales: 6.88 vs 4.96
What this code does
Comparing two ways of calculating a return rate over four days. The first averages each day's own rate, so a quiet day counts as much as a busy one. The second adds up all refunds and all sales first and divides once. The output shows the averaged figure is noticeably higher because one quiet day had an unusually high rate, while the second figure reflects what actually happened to the store's money.
The quiet third day, with sales of 3,000 dollars and refunds of 450, has a rate of 0.15, and averaging lets it pull the result up to about 0.0688. The true rate for the four days is 1,985 dollars of refunds on 40,000 dollars of sales, or about 0.0496. The dashboard uses the ratio of sums, defined once in the data source.
Designing the dashboard
A dashboard is not a collection of every chart that could be drawn. Ravi starts with the managers' four questions and designs one page that answers them in order, from the top left, where eyes go first, to the bottom right.
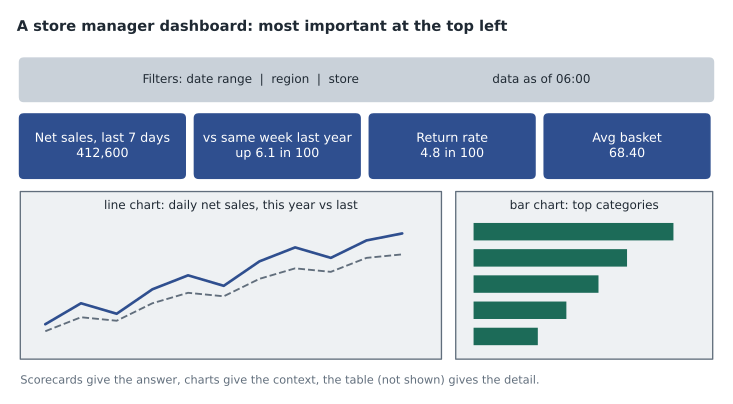
The design follows a few principles worth adopting. Scorecards at the top answer "how are we doing?" with one number each and a comparison, such as the same week last year. Charts below give context: a line chart for change over time, a sorted bar chart for comparing categories. A table at the bottom gives detail for anyone who wants to look up a specific product. Controls let managers change the date range and choose their store; a date range control applies to the data source's date dimension. A line at the top states when the data was last updated, so nobody mistakes yesterday's figures for today's.
Data Studio offers many chart types and styling options, and restraint helps. The team's guide limits each page to one accent color for emphasis, avoids 3D and pie charts with more than a few slices, starts bar chart axes at zero, and labels units in titles, such as "Net sales (dollars)". Lesson 11 covers chart choice and honest presentation in more detail.
Blending, filters and interactivity
Blending combines data from more than one data source in a chart, joined on shared dimensions, for example store sales from BigQuery with store targets kept in a Google Sheet. Blends support several join types and are handy for quick combinations. For anything used widely, Ravi prefers to do the join in BigQuery, in a view, so the logic is visible, testable and reusable outside the report.
Filters can be set on a chart, a page or the whole report. Cross-filtering lets a viewer click a bar, such as the footwear category, and filter every other chart on the page to footwear. Parameters let viewers enter a value, such as a target growth rate, that calculated fields use. Drill-down lets a chart move from region to store to category. These features make one dashboard serve many questions without many copies.
Performance and cost
Each chart in a Data Studio report sends its own query to BigQuery when the cache is empty. A page with twelve charts opened by forty managers each morning can mean hundreds of queries. Four habits keep that fast and cheap: point the report at small, pre-aggregated data such as a materialized view or a summary table rather than raw events; filter on the partition column through the date range control; set a sensible data freshness so the cache absorbs repeated views; and consider BI Engine, which keeps frequently used data in memory and speeds up Data Studio queries considerably.
Data Studio Pro adds features that matter for an official dashboard: content owned by the organization rather than an individual's account, team workspaces, Google Cloud project-level permissions and audit logs, AI features through Gemini, and support. Because the store manager dashboard must outlive any one employee, Ravi plans to build it in a Pro team workspace.
Sharing the first version
Ravi shares the draft with Lena and two pilot store managers as viewers, with link sharing off. Feedback arrives within an hour: one manager wants the comparison to last year shown as a change per 100 dollars of last year's sales, the other wants to see weekdays and weekends separately because her store is in a tourist area. Both changes take minutes, which is exactly what Data Studio is good at. Governed, organization-wide definitions are the subject of the next lesson.
Common mistakes
MistakeCalling Data Studio and Looker the same product.
InsteadData Studio, formerly Looker Studio, is the reporting tool; Looker is the enterprise platform with a LookML semantic model.
MistakeAveraging daily ratios to get a period's rate.
InsteadDivide the sum of the numerator by the sum of the denominator.
MistakePointing a busy dashboard at a raw event table.
InsteadUse pre-aggregated views, partition filters, data freshness and BI Engine.
MistakeUsing owner's credentials without thinking about who can view the report.
InsteadOwner's credentials let every viewer see what the source returns; limit the source or use viewer's credentials.
Before the pilot, Mateo tests the dashboard on a phone, because many store managers will open it on the shop floor. Scorecards stack well on a small screen, but the bar chart of categories is too cramped, so he shortens the category labels and limits the chart to the top eight categories with an "All other" bar.
Worked problem
Return rate for a region
Two stores report for a week. Store A: net sales 80,000 dollars, refunds 3,200. Store B: net sales 20,000 dollars, refunds 1,800. What is the region's return rate, and what would averaging the two store rates give?
Show solution
- Store A rate: 3,200 / 80,000 = 0.040. Store B rate: 1,800 / 20,000 = 0.090.
- Average of the rates: (0.040 + 0.090) / 2 = 0.065.
- Region total: refunds 3,200 + 1,800 = 5,000; sales 80,000 + 20,000 = 100,000.
- Ratio of sums: 5,000 / 100,000 = 0.050.
Answer: The region's return rate is 0.050, or 5 dollars per 100 dollars of sales. Averaging the store rates gives 0.065, overstating it because the small store counts as much as the large one.
Summary and key terms
- Data Studio, called Looker Studio from 2022 until April 2026, is Google's free reporting tool, with a paid Data Studio Pro tier; Looker is the separate enterprise platform with a governed LookML model.
- Use Data Studio for speed and flexibility, Looker when many people need the same governed definitions.
- Reports read data through data sources and connectors; owner's or viewer's credentials decide whose access is used, and data freshness controls caching.
- Calculated fields should divide sums, not average ratios.
- Design dashboards around the audience's questions, with scorecards, charts, a detail table, controls and a data-as-of note.
- Blends, filters, cross-filtering and parameters add interactivity; pre-aggregated sources, partition filters, caching and BI Engine keep reports fast and cheap.
- Data Studio
- Google's reporting and dashboard tool, formerly Looker Studio.
- Data Studio Pro
- The paid tier with organizational ownership, team workspaces and AI features.
- Data source
- A Data Studio object that connects a report to data through a connector.
- Owner's credentials
- A data source setting where queries run with the creator's access.
- Viewer's credentials
- A data source setting where each viewer's own access applies.
- Data freshness
- How long Data Studio caches query results before querying again.
- Calculated field
- A new dimension or metric defined by a formula.
- Blending
- Combining data from several data sources in one chart, joined on shared dimensions.
Practice problems
Work each problem on paper first, then reveal the answer to check.
What is the difference between Data Studio and Looker?
Show answer
Data Studio is a flexible reporting tool where logic lives in each report; Looker is an enterprise platform with metrics defined once in a governed LookML model.
With owner's credentials, does a viewer need BigQuery access to see the data?
Show answer
No; the data source queries as its owner.
How should a period return rate be calculated?
Show answer
Sum of refunds divided by sum of sales.
Name two ways to make a busy dashboard cheaper.
Show answer
Point it at pre-aggregated data and set a longer data freshness; BI Engine and partition filters also help.
Lesson quiz · 5 questions
Score 60% or more to complete this lesson.
Create a free account to save your progress, take quizzes and earn a certificate.