
GCP-221 · Lesson 12 of 12 · 19 min
Lab walkthrough: from question to dashboard
▶ Video coming soon A video version of this lesson is on the way.
The last session, on Wednesday, November 11, is a lab. Ravi gives Mateo a real question from Lena and steps back: "Which stores are behind their November sales target so far, by how much, and is the gap coming from fewer sales or more returns?" Mateo must answer it end to end in his sandbox project, bl-sandbox-mateo, reading production data, and leave behind work that someone else could check. Everything he builds today is a rehearsal for the store manager dashboard planned for December 1.
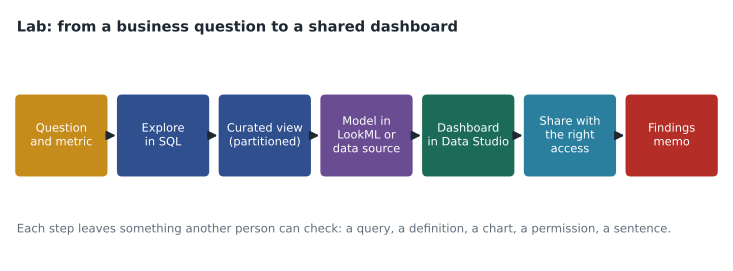
Step 1: pin down the question and the metric
Mateo starts by writing the question in measurable terms, because "behind target" can mean several things. Monthly targets for each store are in reference.store_targets, one row per store per month, set by Finance. Comparing ten days of sales with a whole month's target would make every store look far behind, so the fair comparison is pace: sales so far divided by the share of the month's target that should have been reached by now. Finance spreads each monthly target across days in proportion to last year's daily pattern, but for the lab Ravi agrees to a simpler rule, stated in the memo: the expected share is the number of trading days elapsed divided by the trading days in the month.
| Term | Definition for this lab |
|---|---|
| Net sales to date | Sum of net_sales from v_store_daily, November 1 to yesterday (November 10) |
| Expected to date | Monthly target x days elapsed / days in month = target x 10 / 30 |
| Pace | Net sales to date / expected to date; 1.00 means exactly on target |
| Behind target | Pace below 0.95 |
| Gross sales and refunds | Sales before refunds, and refunds, from v_store_daily, to split the gap |
Step 2: explore in SQL
With definitions fixed, he explores. He checks that every store has a November target, that yesterday's data has arrived, and that v_store_daily has rows for all forty stores on every day. One store, number 27, closed for two days for a flood repair; its target was not adjusted, which he notes as a caveat. Then he writes the core query.
DECLARE as_of DATE DEFAULT DATE "2026-11-10";
DECLARE month_start DATE DEFAULT DATE_TRUNC(as_of, MONTH);
DECLARE days_elapsed INT64 DEFAULT DATE_DIFF(as_of, month_start, DAY) + 1;            -- 10
DECLARE days_in_month INT64 DEFAULT EXTRACT(DAY FROM LAST_DAY(as_of));                -- 30

WITH to_date AS (
  SELECT store_id, region,
         SUM(net_sales) AS net_sales, SUM(net_sales + refunds) AS gross_sales, SUM(refunds) AS refunds
  FROM `bl-data-prod.curated.v_store_daily`
  WHERE sale_date BETWEEN month_start AND as_of
  GROUP BY store_id, region
)
SELECT
  d.store_id, d.region, d.net_sales, d.gross_sales, d.refunds,
  t.target * days_elapsed / days_in_month                         AS expected,
  ROUND(SAFE_DIVIDE(d.net_sales, t.target * days_elapsed / days_in_month), 3) AS pace
FROM to_date AS d
JOIN `bl-data-prod.reference.store_targets` AS t
  ON t.store_id = d.store_id AND t.month = month_start
ORDER BY pace;
The dry run estimates 41 MiB, because v_store_daily filters curated.sales by its partition column. The query uses GoogleSQL script variables declared with DECLARE, so the same script can be rerun tomorrow by changing one date.
Step 3: check the logic on a small case
Before trusting the forty-store result, Mateo reproduces the calculation for four stores with numbers he can follow, using SQLite in the browser. The check also splits each store's gap into a part from lower gross sales and a part from higher refunds, compared with what the target implied.
import sqlite3
db = sqlite3.connect(":memory:")
db.executescript("""
CREATE TABLE to_date (store_id INT, gross REAL, refunds REAL);
INSERT INTO to_date VALUES (12, 96000, 4800), (15, 128000, 5600), (22, 70000, 7700), (27, 80000, 3200);
CREATE TABLE targets (store_id INT, target REAL);
INSERT INTO targets VALUES (12, 300000), (15, 360000), (22, 240000), (27, 270000);
""")
days_elapsed, days_in_month = 10, 30
normal_refund_rate = 0.045      # refunds per dollar of gross sales assumed in targets
sql = """SELECT d.store_id, d.gross, d.refunds, d.gross - d.refunds AS net,
                t.target * ? / ? AS expected
         FROM to_date d JOIN targets t USING (store_id) ORDER BY store_id"""
print("store  net      expected  pace   gap    from refunds")
for store, gross, refunds, net, expected in db.execute(sql, (days_elapsed, days_in_month)):
    pace = net / expected
    gap = expected - net
    extra_refunds = refunds - gross * normal_refund_rate
print(f"{store:5} {net:7,.0f} {expected:8,.0f} {pace:5.3f} {gap:6,.0f} {extra_refunds:7,.0f}")store net expected pace gap from refunds 12 91,200 100,000 0.912 8,800 480 15 122,400 120,000 1.020 -2,400 -160 22 62,300 80,000 0.779 17,700 4,550 27 76,800 90,000 0.853 13,200 -400
What this code does
Checking the pace calculation by hand for four stores. For each store it computes net sales so far, the expected sales for ten days of a thirty-day month, the pace as their ratio, the gap in dollars, and how much of the refunds is above the normal rate assumed in the targets. The output shows which stores are behind and whether extra refunds explain much of each gap.
The check confirms the method. Store 22 is furthest behind, at a pace of 0.779, and 4,550 dollars of its 17,700-dollar gap comes from refunds above the normal rate, so most of its shortfall is lower sales, not returns. Store 27 is at 0.853, consistent with its two closed days; store 12 is at 0.912; store 15 is ahead of pace at 1.020. The forty-store query gives the same figures for these four stores, so Mateo trusts it.
Step 4: save the logic once
The pace calculation will feed a daily dashboard, so Mateo saves it properly rather than pasting the script into a report. He creates a view, v_store_pace, in his sandbox with a description stating every definition from step 1, and asks Ravi to review it for the shared_reporting dataset. For the Looker side, he drafts two LookML measures in Development Mode, expected_to_date and pace, with descriptions and value formats, and opens a pull request. Ravi suggests one change: compute pace as a ratio of sums in LookML, sum of net sales over sum of expected, so that pace for a region is weighted by store size rather than an average of store paces, the ratio trap from lesson 8.
Step 5: build the dashboard page
In a copy of the store manager dashboard, Mateo adds a "November pace" page. The design follows lesson 8 and lesson 11: a scorecard of company pace with the comparison "vs 1.00 target pace"; a sorted bar chart of store pace with a reference line at 0.95 and stores below it highlighted; a small table of the stores behind target with the gap split into lower sales and extra refunds; and a note at the top saying the figures run to yesterday and use even daily pacing. The title of the bar chart says what to see: "7 stores are behind November pace".
| Element | Choice | Reason |
|---|---|---|
| Data source | v_store_pace through viewer's credentials | Row access policies decide which stores each manager sees in detail |
| Data freshness | 12 hours | Data loads once a day by 05:30; cache absorbs repeat views |
| Main chart | Sorted bar chart with a 0.95 reference line | Compares stores; the line shows the threshold |
| Color | Gray bars, accent color for stores below 0.95, plus a text label | One accent color; not color alone |
| Detail | Table of behind-target stores with the gap split | Answers the second half of Lena's question |
Step 6: share with the right access
Mateo shares the draft page with Lena, Ravi and the two pilot managers, as viewers, with link sharing off. Because the page uses viewer's credentials on a table with row access policies, he asks one pilot manager to open it and confirm she sees her own store in detail and only regional totals elsewhere. He also confirms that the new view exposes no transaction-level columns, so nothing on the page needs a policy tag.
Step 7: write the findings
The memo follows the template from lesson 11 and fits on one page.
| Section | Text |
|---|---|
| Answer | Seven of forty stores are behind November pace after ten days. Together they are about 96,000 dollars short of the expected figure, and lower sales, not returns, explain most of the gap. |
| Evidence | Store pace chart; gap split table (refunds above normal account for about 21,000 dollars of the 96,000); store 27 closed two days for repairs. |
| Recommendation | Regional managers to review staffing and local promotions in the six stores behind for reasons other than closure; Finance to decide whether to adjust store 27's target. |
| Caveats | Even daily pacing ignores weekend and payday patterns; ten days is early; refunds for early-November web orders are still arriving. |
| Method | v_store_pace (sandbox, pending review), definitions in its description; LookML pull request; dashboard draft link. |
The caveat about even pacing matters. November 1, 2026 was a Sunday, so the first ten days include three weekend days, and stores that sell most on weekends look slightly better on an even pace than they will by the end of the month. Mateo suggests that the production version use Finance's daily target profile instead, which is a change to one table and one line of the view.
Ravi's review
Ravi reviews the lab against the course. The question was turned into written definitions before any SQL. Partition filters kept the work cheap. A small case was checked by hand. Logic was saved once, in a view and a governed measure, with ratio-of-sums aggregation. The chart answered one question and said so in its title. Access was tested, not assumed. And the memo led with the answer, split the cause, and stated its limits. His only addition is a reminder for the exam and for work: write down what you assumed, because next month someone will ask.
Common mistakes
MistakeComparing month-to-date sales with a whole month's target.
InsteadCompare with the expected share of the target to date, and state the pacing rule.
MistakeAveraging store paces to get a region's pace.
InsteadDivide total net sales by total expected sales.
MistakePasting an analysis script into a report as a custom query.
InsteadSave the logic in a reviewed view or LookML measure and point the report at it.
MistakeSharing a dashboard without testing what a real viewer sees.
InsteadAsk a member of each audience group to open it, and confirm row and column restrictions.
Mateo also writes a short handover note for whoever maintains the page after launch: where the view and measures live, which tables they read, when the data arrives, how to change the pacing rule, and whom to ask about targets. Ravi calls it the most underrated deliverable in analytics, because a dashboard without an owner and a note stops being trusted the first time a number looks odd.
Worked problem
Pace for one store
Store 33 has a November target of 330,000 dollars. After 10 of 30 days its gross sales are 108,000 dollars and refunds are 6,300 dollars. The target assumes refunds of 0.045 of gross sales. What is its pace, and how much of any gap is extra refunds?
Show solution
- Net sales to date: 108,000 - 6,300 = 101,700 dollars.
- Expected to date: 330,000 x 10 / 30 = 110,000 dollars.
- Pace: 101,700 / 110,000 = 0.925, below the 0.95 threshold. Gap: 110,000 - 101,700 = 8,300 dollars.
- Normal refunds: 108,000 x 0.045 = 4,860 dollars, so extra refunds are 6,300 - 4,860 = 1,440 dollars.
Answer: Pace is 0.925, so the store is behind target by 8,300 dollars, of which about 1,440 comes from refunds above normal; most of the gap is lower sales.
Summary and key terms
- The lab follows one question from definition to decision.
- Write measurable definitions first, such as pace as sales to date over the expected share of the target.
- Explore with SQL that filters on the partition column, using script variables for dates.
- Check the logic on a small case you can follow by hand.
- Save the logic once in a described view and governed LookML measures, using ratio-of-sums aggregation.
- Build a focused dashboard page with a clear title, a threshold line, one accent color and a detail table.
- Share with groups and test what real viewers see under row access policies.
- Write a memo that leads with the answer, splits the cause, gives a recommendation and states caveats.
- Pace
- Sales to date divided by the share of the target expected by that date.
- Script variable
- A value declared with DECLARE in a GoogleSQL script and reused in its queries.
- Reference line
- A line on a chart marking a target or threshold.
- Even pacing
- Spreading a target equally across the days of a period.
- Target profile
- A daily pattern used to spread a period's target unevenly, for example by weekday.
- Pull request
- A proposed change submitted for review before it is merged.
- Gap split
- Dividing a shortfall into the parts explained by different causes.
- Sandbox project
- A separate project where an analyst can build and test without affecting production.
Practice problems
Work each problem on paper first, then reveal the answer to check.
Why is pace a fairer measure than sales to date against the monthly target?
Show answer
It compares sales with the share of the target that should have been reached by now.
How should a region's pace be calculated?
Show answer
Total net sales divided by total expected sales for the region.
Why use DECLARE for the dates in the lab script?
Show answer
So the script can be rerun for another day by changing one value.
What does the even-pacing caveat warn about?
Show answer
Weekday and weekend patterns mean early-month pace can overstate or understate the final result.
Lesson quiz · 5 questions
Score 60% or more to complete this lesson.
Create a free account to save your progress, take quizzes and earn a certificate.