
GCP-221 · Lesson 11 of 12 · 18 min
Communicating findings
▶ Video coming soon A video version of this lesson is on the way.
Ravi adds a short Monday session on November 9 because, as he puts it, an analysis nobody understands has not happened. The occasion is Lena's quarterly review with the regional managers, for which Mateo must present what the team found about returns this autumn. He has a strong finding, the boot sizing problem from lesson 7, and a confusing one: the overall web return rate rose from the third quarter of 2025 to the third quarter of 2026, yet it fell in almost every product category. This session is about turning results like these into a message people can act on.
Start with the audience and the decision
Before writing a single sentence, ask who will read the findings and what they will decide. Regional managers have twenty minutes, think in stores and categories rather than tables, and decide where to send merchandising and customer service effort next quarter. Finance wants exact figures that reconcile with its own reports. Executives want the answer and the size of the money at stake. The same analysis becomes three different pieces of communication, and Mateo's first draft, a ten-slide tour of every query he wrote, serves none of them.
| Audience | Needs | Format |
|---|---|---|
| Regional managers | What changed, where, and what to do about it | One-page summary with two charts, then the dashboard |
| Finance | Exact, reconcilable figures and definitions | A table with definitions and the query used |
| Executives | The answer, the money involved, the recommendation | Three sentences and one number |
| Other analysts | Method, data sources, caveats, reproducibility | A notebook or documented SQL in the repository |
Lead with the answer
Business readers want the conclusion first, then the support. A useful structure is: the answer in one sentence, two or three supporting points with evidence, then the recommendation and any caveats. This is sometimes called the pyramid principle. Mateo rewrites his opening from "This analysis examined web returns from July to September across all categories" to "Web returns cost about 39,000 dollars more this quarter than last year, mainly because customers bought more footwear, which is returned more often; within most categories, return rates actually improved." The second version tells the reader what happened before they decide whether to read on.
Give every number a comparison
A number alone means little. "Return rate 6.4 in 100" is only useful next to something: last year, the target, other regions, or other categories. Each headline figure in Mateo's summary carries a comparison and a time frame, and each comparison is fair, using the same calendar period, the same definition and, where seasonality matters, the same weeks of the year. Lesson 2's August and September example showed how unequal periods can mislead.
Units and precision matter too. Monetary figures are rounded to what the decision needs: "about 39,000 dollars" in the summary, exact cents only in Finance's table. Rates are written consistently, and since Birchline's house style writes rates in words rather than symbols, Mateo writes "6.4 in every 100 orders" or "6.4 per 100 orders". Large counts get thousands separators. Dates name the year.
Choose the chart for the question
Each chart should answer one question, stated in its title. "Footwear returns jumped after October 6" is a better title than "Returns by category by day", because it tells the reader what to see.
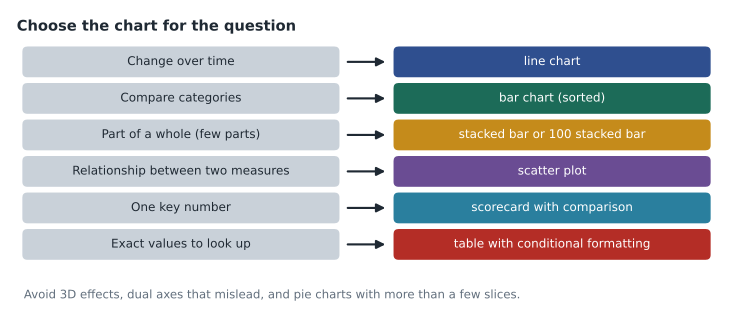
A few rules prevent most misleading charts. Bar charts start at zero, because the length of a bar is read as the size of the value. Line charts may start elsewhere, but the axis should be clearly labeled. Avoid two different measures on two y-axes, which invites readers to see relationships that depend only on the scales chosen. Sort bar charts by value unless the categories have a natural order such as months. Use color sparingly and meaningfully, one accent color for the thing that matters and gray for the rest, and do not rely on red and green alone, since many readers cannot tell them apart; add labels or patterns.
The mix effect: when the whole disagrees with the parts
Mateo's confusing result is a classic. The overall web return rate rose, but the rate fell in most categories. Both statements are true at once, because the mix of what customers bought changed: footwear, which is returned far more often than other categories, made up a larger share of web sales in 2026. This pattern, where a trend in the combined data reverses the trend within every group, is known as Simpson's paradox. Reporting only the overall rate would wrongly suggest service or quality got worse everywhere.
# Web sales and returns by category, third quarter (thousands of dollars)
data = {
    #             2025 sales, 2025 returns, 2026 sales, 2026 returns
    "Footwear": (300, 42.0, 700, 91.0),
    "Apparel":  (900, 54.0, 850, 46.8),
    "Camping":  (800, 24.0, 750, 21.0),
}
print("category   2025 rate  2026 rate")
for cat, (s25, r25, s26, r26) in data.items():
    print(f"{cat:9}  {r25 / s25:9.3f}  {r26 / s26:9.3f}")

tot = [sum(v[i] for v in data.values()) for i in range(4)]
print(f"{'Overall':9}  {tot[1] / tot[0]:9.3f}  {tot[3] / tot[2]:9.3f}")
print(f"Footwear share of sales: {data['Footwear'][0] / tot[0]:.2f} -> {data['Footwear'][2] / tot[2]:.2f}")
print(f"Extra returns in dollars: {(tot[3] - tot[1]) * 1000:,.0f}")category 2025 rate 2026 rate Footwear 0.140 0.130 Apparel 0.060 0.055 Camping 0.030 0.028 Overall 0.060 0.069 Footwear share of sales: 0.15 -> 0.30 Extra returns in dollars: 38,800
What this code does
Showing how the overall return rate can rise while every category's rate falls. Each category has sales and returns for both years. The output shows each category's rate going down from 2025 to 2026, the overall rate going up, and footwear's share of sales rising sharply. Because footwear has by far the highest return rate, selling more of it lifts the overall figure even though each category improved, and the last line shows the extra dollars of returns.
The output shows exactly the pattern in Birchline's data: footwear fell from 0.140 to 0.130, apparel from 0.060 to 0.055, camping from 0.030 to 0.028, yet the overall rate rose from 0.060 to 0.069, because footwear's share of web sales grew from 0.15 to 0.30. Mateo's summary says both things, in that order, with one chart of rates by category and one of the sales mix. The recommendation follows naturally: focus on footwear sizing, where most returns now come from, rather than on general return processes.
Correlation, causation and uncertainty
Analysts are often asked "why", and data more easily shows "what" and "together with what". Stores that ran the autumn promotion had higher sales, but they were also the stores chosen because they were already busy. Saying "the promotion raised sales" from that comparison confuses correlation with causation. Stronger evidence comes from a fair comparison: similar stores with and without the promotion, or a test where stores are assigned at random. When only correlation is available, say so plainly: "stores that ran the promotion sold more; we cannot yet tell how much of that was the promotion."
Uncertainty belongs in the message too. A forecast from lesson 6 has a prediction interval, and the summary should give the range, not only the middle: "holiday sales are forecast at 4.1 million dollars, likely between 3.8 and 4.4 million." A difference between two small groups may be noise; with only a few hundred orders in a store, a change in return rate of one or two orders per hundred can easily happen by chance. If a result would change a decision, check whether it holds over a longer period or a larger group before presenting it as fact.
Writing the findings memo
Birchline's analytics team uses a short template for written findings, and Mateo's quarterly memo follows it.
| Section | Contents | Mateo's memo |
|---|---|---|
| Answer | One or two sentences | Returns cost about 39,000 dollars more, driven by more footwear sales; rates improved in most categories |
| Evidence | Two or three points, each with a chart or number | Rates by category; sales mix; boot model returns after the size chart change |
| Recommendation | What to do, who should do it, by when | Merchandising to review size charts for the top 20 footwear SKUs before the holiday peak |
| Caveats | What the analysis cannot show | Third quarter only; returns still arriving for September orders |
| Method and sources | Tables, definitions, links to queries and dashboard | v_store_daily, curated.returns_by_product_day, the notebook link |
The caveat about September orders is important and easy to forget. Some September orders are still within their return window, so the third-quarter return rate will rise slightly as late returns arrive. Mateo states the size of the effect, about one return per 1,000 orders based on last year's late returns, so nobody is surprised when the figure moves.
Making results reusable and accessible
Findings should outlive the meeting. The dashboard keeps the key charts current; a scheduled email delivery from Data Studio sends a PDF of the summary page to regional managers every Monday at 07:00; the notebook and SQL live in the team's repository so another analyst can reproduce the numbers. For accessibility, charts have descriptive titles, the text includes the key numbers so screen-reader users and people reading on a phone get the message without the chart, and color is never the only way information is shown.
Common mistakes
MistakeOpening with the method instead of the answer.
InsteadLead with the conclusion, then the evidence, then the recommendation and caveats.
MistakeReporting only an overall rate when the mix has changed.
InsteadShow rates within groups and the mix; explain if the whole and the parts disagree.
MistakeCalling a correlation a cause.
InsteadSay what the data shows; look for a fair comparison or a test before claiming a cause.
MistakeGiving a single forecast number.
InsteadGive the range as well as the central estimate.
Presenting in the meeting
Written findings and spoken ones differ. In the quarterly review, Mateo has ten minutes, so he plans three slides, each with one message in its title: returns cost more because the mix shifted to footwear; within categories, return rates improved; one boot model's size chart caused a spike that is now fixed. He rehearses saying each message in a single sentence before showing the chart, then pointing to the part of the chart that proves it. Questions he expects, such as "how do we know it is not a quality problem?", get a short prepared answer and a backup chart rather than an improvised query during the meeting.
He also prepares for disagreement. A regional manager is likely to say her stores' returns feel higher than ever; the evidence answers that her stores' rate fell, while their footwear sales doubled. Ravi's advice is to acknowledge the experience and then show the number that explains it, because people accept data more readily when it accounts for what they have seen. After the meeting, Mateo sends the memo and the dashboard link, so the discussion continues from the same facts.
Worked problem
Explaining a mix effect
Store returns: in 2025 a store sold 200,000 dollars of footwear with 20,000 returned and 800,000 of other goods with 24,000 returned. In 2026 it sold 400,000 of footwear with 36,000 returned and 600,000 of other goods with 15,000 returned. What happened to each rate and the overall rate?
Show solution
- Footwear: 20,000 / 200,000 = 0.100 in 2025; 36,000 / 400,000 = 0.090 in 2026. It fell.
- Other goods: 24,000 / 800,000 = 0.030 in 2025; 15,000 / 600,000 = 0.025 in 2026. It fell.
- Overall 2025: 44,000 / 1,000,000 = 0.044. Overall 2026: 51,000 / 1,000,000 = 0.051. It rose.
- Footwear went from 20 to 40 in every 100 dollars of sales, and footwear is returned far more often.
Answer: Both category rates fell, but the overall rate rose from 0.044 to 0.051 because sales shifted toward footwear. The message should say both, and point effort at footwear.
Summary and key terms
- Communicate for the audience and the decision they face, adapting the same findings for managers, finance, executives and analysts.
- Lead with the answer, then evidence, recommendation and caveats.
- Give every number a fair comparison, sensible rounding and clear units.
- Choose charts to match the question and title them with the message; start bars at zero, avoid misleading dual axes and do not rely on color alone.
- When the overall trend disagrees with the trend in every group, explain the mix effect.
- Do not present correlation as causation, and show uncertainty as ranges.
- Write short memos with method and sources, and make results reusable through dashboards, scheduled delivery and documented queries.
- Pyramid principle
- Presenting the conclusion first, followed by supporting points.
- Mix effect
- A change in an overall figure caused by a change in the share of groups rather than within them.
- Simpson's paradox
- A trend that appears in every group but reverses when the groups are combined.
- Correlation
- Two measures moving together, without showing that one causes the other.
- Causation
- One thing directly producing a change in another.
- Prediction interval
- A range expected to contain a future value with stated confidence.
- Caveat
- A stated limit on what an analysis can show.
- Scheduled delivery
- A report sent automatically by email on a set schedule.
Practice problems
Work each problem on paper first, then reveal the answer to check.
Why should a bar chart axis start at zero?
Show answer
Readers judge bars by length, so a cut axis exaggerates differences.
The overall return rate rose but every category rate fell. What is the likely cause?
Show answer
A shift in the sales mix toward categories with higher return rates.
How should a forecast be presented?
Show answer
As a central estimate with a range, such as a prediction interval.
What goes first in a findings memo?
Show answer
The answer, in one or two sentences.
Lesson quiz · 5 questions
Score 60% or more to complete this lesson.
Create a free account to save your progress, take quizzes and earn a certificate.