
GCP-101 · Lesson 11 of 12 · 18 min
Operations: monitoring and logging basics
▶ Video coming soon A video version of this lesson is on the way.
In the old data center, Owen found out about most problems from the help desk phone. A store manager would call to say the scheduling app was slow, and he would log into three servers to look for clues. "In the cloud you have far better information than that," Farah says, "but only if you collect it, look at it and decide in advance what counts as a problem." This lesson covers the operations tools that keep Birchline's systems healthy after they move: metrics, logs, alerts, traces and the habits that turn them into reliable service.
Google Cloud groups these tools under Google Cloud Observability, which includes Cloud Monitoring, Cloud Logging, Error Reporting, Cloud Trace and Cloud Profiler. They work across Google Cloud services, and with agents and open standards they also cover applications on VMs, on other clouds and on premises.
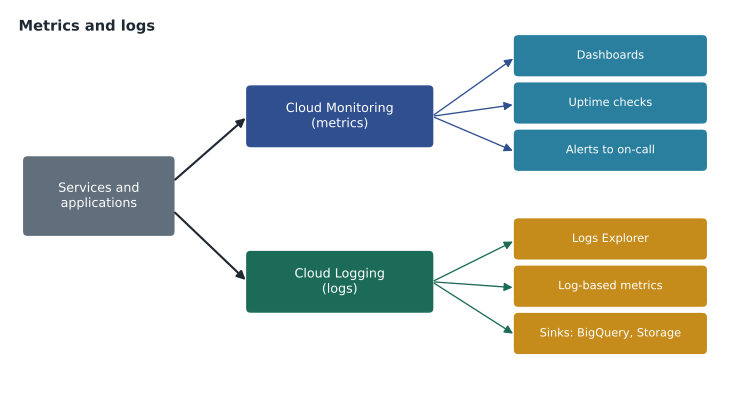
Metrics and Cloud Monitoring
A metric is a number measured over time, such as a VM's CPU use, a Cloud Run service's request count and latency, a Cloud SQL instance's connections, or a bucket's stored bytes. Google Cloud services publish thousands of metrics to Cloud Monitoring automatically, with no setup. For VMs, the Ops Agent adds metrics from inside the operating system, such as memory and disk use, and collects application logs. Applications can also send their own custom metrics, such as orders placed per minute, and Monitoring accepts metrics in the open-source Prometheus and OpenTelemetry formats.
Monitoring brings metrics together in dashboards. Google provides ready-made dashboards for many services, and teams build their own. Birchline's shop dashboard shows the four measures site reliability engineers call the golden signals: latency (how long requests take), traffic (how many requests arrive), errors (how many fail) and saturation (how full the resources are). Ravi adds a business chart beside them, orders per minute, because a sudden drop in orders is often the first sign that something technical is wrong.
Alerting and uptime checks
Nobody watches dashboards all night, so Monitoring uses alerting policies. A policy defines a condition, such as error responses above 2 in every 100 requests for five minutes, or CPU above 90 out of 100 for fifteen minutes, and notification channels to tell when the condition is met: email, SMS, a mobile app push, Slack, PagerDuty, Pub/Sub or a webhook. Each alert opens an incident in Monitoring that records when it started and ended.
Uptime checks test a service from outside, by requesting a URL or opening a TCP port from probes in several locations around the world every minute or so. If the checks fail from multiple locations, an alert fires even if no internal metric looks wrong, which catches problems such as an expired certificate or a DNS mistake. Birchline runs uptime checks against the shop's home page, the checkout API's health endpoint and the returns portal.
Farah has strong opinions about alerts. Every alert should be actionable: if someone is woken at three in the morning, there must be something for them to do, written in a short runbook linked from the alert. Alerts that fire often and need no action teach people to ignore alerts, which is how real problems are missed. So Birchline alerts on what users experience, such as errors and slow checkouts, and uses dashboards rather than pages for everything else.
| Signal | Example measure | Alert when |
|---|---|---|
| Latency | p95 checkout API response time (95 in every 100 requests are faster) | Above 800 ms for 10 minutes |
| Traffic | Requests per second to the shop | Unexpectedly near zero during opening hours |
| Errors | Share of 5xx responses | Above 2 in every 100 requests for 5 minutes |
| Saturation | Cloud SQL CPU and connections | CPU above 85 out of 100 for 15 minutes |
| Availability | Uptime checks from several regions | Failing from two or more locations |
Logs and Cloud Logging
A log entry records an event: a web request served, an application error, a VM booting, a person changing an IAM policy. Cloud Logging collects log entries from Google Cloud services automatically, from applications that write to standard output on Cloud Run and GKE, and from VMs through the Ops Agent. Logs are searchable in the Logs Explorer with a query language that filters by resource, severity, time and any field in the entry. Log Analytics lets teams query logs with SQL, as in BigQuery.
Some logs are especially important. Cloud Audit Logs record who did what to which resource: Admin Activity audit logs, always on and free, record configuration changes such as creating a VM or changing a policy; Data Access audit logs, which must be enabled for most services, record reads and writes of data; and System Event and Policy Denied logs record actions by Google systems and refused requests. Teresa relies on these to investigate any security question.
Logs are stored in log buckets. Every project has a _Required bucket, which holds Admin Activity and some other audit logs for 400 days and cannot be changed or deleted, and a _Default bucket for most other logs, kept for 30 days by default, though the retention can be changed. Logs are routed into buckets by sinks, and sinks can also send copies elsewhere: to BigQuery for analysis, to Cloud Storage for cheap long-term retention, or to Pub/Sub for other tools such as a security monitoring system.
gcloud logging read 'resource.type="cloud_run_revision" AND severity>=ERROR' --limit=20 --freshness=1h
gcloud logging sinks create audit-to-central \
    storage.googleapis.com/bl-audit-archive \
    --organization=ORGANIZATION_ID --include-children \
    --log-filter='logName:"cloudaudit.googleapis.com"'
Birchline uses an aggregated sink at the organization level that copies every project's audit logs to a central bucket in a security project, where retention is locked for seven years and even project owners elsewhere cannot delete entries. Application teams keep their own logs in their projects for 30 days, which is enough for troubleshooting, and route request logs to BigQuery when they need longer analysis.
Logs can also become metrics. A log-based metric counts log entries that match a filter, such as payment failures written by the order API, and can drive charts and alerts like any other metric.
Errors, traces and profiles
Three further tools help developers find causes rather than symptoms. Error Reporting groups application errors and stack traces from logs, counts them and shows when each new kind of error first appeared, which is often right after a deployment. Cloud Trace follows a single request as it passes through several services, showing how long each step took; Jules's team used it to discover that slow checkouts were caused by a call to the tax calculation service, not the database. Cloud Profiler samples where running code spends CPU and memory, with low overhead, so teams can find inefficient functions in production.
Reliability targets: SLIs, SLOs and error budgets
Google's site reliability engineering (SRE) practice gives Birchline a way to decide how reliable is reliable enough. A service level indicator (SLI) is a measurement of what users experience, such as the proportion of checkout requests that succeed in under a second. A service level objective (SLO) is the target for that indicator over a period, such as 99.5 of every 100 checkout requests succeeding quickly over 28 days. The gap between perfect and the target is the error budget: the amount of failure the team can tolerate before reliability work must take priority over new features.
requests_28_days = 4_000_000
slo = 0.995                      # 99.5 good requests in every 100
budget = requests_28_days * (1 - slo)
bad_so_far = 12_600
print("error budget (bad requests allowed):", int(budget))
print("used so far:", bad_so_far)
print("share of budget used:", round(bad_so_far / budget, 2))error budget (bad requests allowed): 20000 used so far: 12600 share of budget used: 0.63
What this code does
A service level objective of 99.5 good requests in every 100 means a small number of failures is allowed over 28 days, called the error budget. The program multiplies the request count by the allowed failure share to get 20,000 bad requests. With 12,600 used so far, about 0.63 of the budget is gone.
Cloud Monitoring can define SLOs on services and alert on the burn rate, how fast the error budget is being used, which catches both a sudden outage and a slow leak of failures. Birchline sets SLOs for the shop's checkout and product pages first. When the team burned most of a month's budget during one bad release, the next sprint was spent on deployment safety instead of new features, exactly as the SLO policy said it should be.
Day-two operations
Monitoring and logging are the core of day-two operations, the work of running systems after they are built. Farah adds a few other habits to Owen's list: review Active Assist recommendations for idle or oversized resources and security improvements every week; check Google Cloud Service Health and the personalized Service Health dashboard when something odd happens, in case the cause is a Google incident; practice restoring backups; write a short postmortem after every significant incident, focused on causes and fixes rather than blame; and keep the runbooks up to date.
Common mistakes
MistakeAlerting on every metric that changes.
InsteadAlert on user-facing symptoms with clear actions; watch everything else on dashboards.
MistakeKeeping audit logs only in the project where they are created.
InsteadCopy them with an aggregated sink to a central, locked bucket.
MistakeAssuming Data Access audit logs are recorded by default for every service.
InsteadEnable them where needed; only Admin Activity logs are always on.
MistakeSetting an SLO of 100.
InsteadNo system is perfect; choose a target users would accept and use the error budget to balance speed and reliability.
When the pager goes off
Tools only help if people know what to do with them. Birchline writes a short incident process before the shop moves, and Farah walks Owen through it using a practice scenario: at 7:40 on a Saturday morning, the checkout error alert fires.
First, someone takes charge. The on-call engineer acknowledges the alert so others know it is being handled, and for anything affecting customers declares an incident with a clear owner, the incident commander, whose job is coordination, not typing commands. Second, the team mitigates before it investigates: if errors began right after a release, rolling back to the previous Cloud Run revision restores service in seconds, and the cause can be found afterwards. Third, someone communicates: a short message to the store operations channel and, if shoppers are affected, a status note on the website, updated on a regular schedule.
During the incident, the observability tools answer specific questions. The shop dashboard shows when errors started and whether latency and traffic changed too. Error Reporting shows whether a new kind of error appeared and in which release. Logs Explorer, filtered to the checkout service and severity ERROR, shows the exact messages. Cloud Trace shows whether one slow dependency is holding everything up. And the audit logs show whether anyone changed a configuration just before the problem began, which is the cause surprisingly often.
Afterwards comes the postmortem. It records the timeline, the impact, the causes, what went well, what went badly and a list of actions with owners and dates. Farah insists that postmortems name systems and decisions, not people to blame, because engineers who fear blame hide information, and hidden information is how the same incident happens twice. The first Birchline postmortem, after a practice game day, produced three actions: a missing alert on the payment provider's error rate, a runbook step that referred to the old data center, and a dashboard that nobody could find.
Worked problem
Designing alerts for the returns portal
The returns portal runs on Cloud Run. Users complain when it is down or takes more than three seconds. Design two alerts and say where logs should go.
Show solution
- Alert 1, availability: an uptime check on the portal's health URL from several regions, alerting the on-call channel when it fails from two or more locations.
- Alert 2, latency: an alerting policy on p95 request latency (the time that 95 in every 100 requests beat) above 3 seconds for 10 minutes, linked to a runbook.
- Logs: Cloud Run writes request and application logs to Cloud Logging automatically; keep them 30 days in the _Default bucket, send error logs to Error Reporting, and rely on the organization sink for audit logs.
Answer: An uptime check, a latency policy with a runbook, and the default log routing plus the central audit sink.
Summary and key terms
- Google Cloud Observability includes Cloud Monitoring, Cloud Logging, Error Reporting, Cloud Trace and Cloud Profiler.
- Monitoring collects service metrics automatically, adds VM and custom metrics through the Ops Agent and open standards, and provides dashboards, alerting policies with notification channels, and uptime checks; good alerts are actionable and focus on the golden signals users feel.
- Logging collects platform, application and audit logs, searchable in Logs Explorer and Log Analytics, stored in _Required and _Default buckets and routed by sinks to BigQuery, Cloud Storage or Pub/Sub.
- SLIs, SLOs and error budgets set reliability targets; day-two operations add recommendations, Service Health, restore tests and blameless postmortems.
- Metric
- A numerical measurement collected over time.
- Ops Agent
- The agent that collects metrics and logs from inside Compute Engine VMs.
- Alerting policy
- A condition on metrics or logs that notifies people when it is met.
- Uptime check
- A test of a service's availability from probes around the world.
- Golden signals
- Latency, traffic, errors and saturation.
- Cloud Audit Logs
- Records of administrative actions, data access and system events.
- Log sink
- A rule that routes matching log entries to a destination.
- SLO
- Service level objective: a target for a user-facing measure over a period.
- Error budget
- The amount of failure allowed by an SLO.
- Postmortem
- A written review of an incident focused on causes and improvements.
Practice problems
Work each problem on paper first, then reveal the answer to check.
Which audit logs are always on and cannot be turned off?
Show answer
Admin Activity audit logs.
Where should long-term copies of audit logs go?
Show answer
To a central bucket, through an aggregated sink, with locked retention.
What does an uptime check catch that internal metrics might miss?
Show answer
Problems users see from outside, such as DNS errors or expired certificates.
Lesson quiz · 5 questions
Score 60% or more to complete this lesson.
Create a free account to save your progress, take quizzes and earn a certificate.