
FIN-301 · Lesson 8 of 12 · 27 min
Equity analysis and valuation in practice
FIN-201 lesson 6 introduced the tools for valuing shares: the dividend discount model, sustainable growth, two-stage models, discounted free cash flow and multiples. This lesson looks at how investment analysts use those tools in practice. It follows the top-down process from the economy to the industry to the company, introduces the residual income model, which values a company from its accounting book value and its ability to earn more than its cost of equity, links valuation multiples to fundamentals, and shows how to read the market's own expectations back out of a share price. The aim is not a formula that reveals the true value, which does not exist, but a disciplined way to test whether a price makes sense.
Top-down analysis: the economy
Most professional analysis starts with the economy, because a company's sales, margins and cost of capital depend on economic growth, interest rates, inflation and exchange rates. Share markets tend to anticipate the business cycle, falling before recessions and recovering before the economy does. Sectors respond differently to the cycle. Cyclical industries, such as autos, materials, industrial equipment and consumer discretionary goods, are highly sensitive to economic activity. Defensive industries, such as utilities, consumer staples and health care, are less sensitive. Interest-rate-sensitive sectors, such as real estate, banks and utilities, react strongly to central bank decisions described in ECON-102 lesson 8. Managers who try to shift between sectors as the cycle turns, sector rotation, need to forecast the cycle better than everyone else, which is notoriously difficult.
For US equities the economic picture is dominated by domestic demand, technology investment and interest rates, because large technology and communication companies make up a large share of the S&P 500. A rise in oil prices, such as the shock in 2026, tends to help energy producers but hurts consumers and energy-intensive industries. Many large US companies earn much of their revenue abroad, so a strong US dollar reduces their reported results.
Industry analysis
Next, the analyst studies the industry. Industries move through a life cycle: start-up with rapid growth and high failure rates, consolidation, maturity with growth near the economy's rate, and relative decline. The stage matters for valuation, because a mature industry cannot sustain high growth for long. Michael Porter's five forces, covered in BUS-450 lesson 2, explain why some industries earn persistently high returns on capital while others do not: barriers to entry, supplier and buyer power, substitutes and rivalry. Industry analysis also asks how sensitive sales are to the economy and how high the operating and financial leverage is, both of which, as FIN-201 lessons 9 and 12 showed, magnify swings in profits.
Company analysis and earnings quality
Finally, the analyst studies the company itself: its competitive advantage, management, financial statements and forecasts. A central question is the quality of earnings. Reported profit can be inflated by aggressive accounting choices, such as recognizing revenue early or capitalizing costs that should be expensed. One warning sign is a large gap between net income and operating cash flow, called accruals: research by Richard Sloan in 1996 found that companies with high accruals tended to have lower future returns. Analysts also adjust for one-time items, watch for growth bought through acquisitions, and compare the company's ratios with peers using the DuPont analysis from FIN-201 lesson 2.
US public companies file their annual reports (Form 10-K), quarterly reports (Form 10-Q) and current reports on material events (Form 8-K) on the SEC's EDGAR system. They report under US GAAP, while foreign private issuers listed in the United States may use IFRS.
The residual income model
The residual income model values a company as its book value of equity today plus the present value of all future residual income: the profit earned in excess of the return shareholders require on the book value they have invested. A company that earns exactly its cost of equity on its book value is worth exactly its book value; one that earns more is worth more. The model gives the same answer as the dividend discount model when the accounting is consistent (the clean surplus relation), but it has practical advantages: much of the value is anchored in today's book value rather than in a distant terminal value, it works for companies that pay no dividends, and it focuses attention on whether the company can earn more than its cost of capital, the source of all value creation.
Here \( B \) is book value per share, \( E \) earnings per share and \( r \) the cost of equity. If ROE stays above \( r \) forever and book value grows at a constant rate \( g \), the formula collapses to a simple ratio of price to book value.
Worked problem
Valuing a bank with residual income
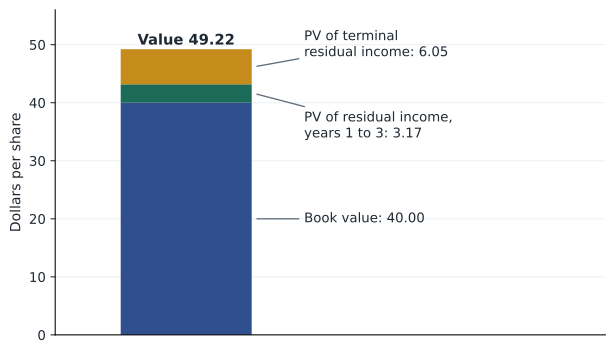
A bank has book value of $40 a share. Analysts expect a return on equity of 13 % for the next three years, then a steady 11 % with book value growing at 4 % a year. The cost of equity is 10 %, and the bank pays out 50 % of earnings during the first three years. Estimate the value per share.
Show solution
- Year 1: earnings 5.20; residual income 5.20 − 4.00 = 1.20; book value grows to 42.60.
- Year 2: earnings 5.54; residual income 5.54 − 4.26 = 1.28; book value 45.37.
- Year 3: earnings 5.90; residual income 5.90 − 4.54 = 1.36; book value 48.32.
- From year 4 the residual income is (0.11 − 0.10) × 48.32 = 0.48, growing at 4 %: terminal value at year 3 = 0.48 ÷ (0.10 − 0.04) = 8.05.
- Value = 40 + PV of 1.20, 1.28, 1.36 and 8.05 at 10 % ≈ 40 + 3.17 + 6.05 = 49.22.
Answer: About 81 % of the value comes from today's book value, so the estimate depends far less on distant forecasts than a dividend model would.
# Residual income valuation and justified multiples
def residual_income_value(b0, roes, payout, r, roe_long, g):
    b, value, pv_factor = b0, b0, 1.0
    for t, roe in enumerate(roes, start=1):
        e = roe * b
        ri = e - r * b
        pv_factor /= (1 + r)
        value += ri * pv_factor
        b = b + e * (1 - payout)
    tv = (roe_long - r) * b / (r - g)
    return value + tv * pv_factor

v = residual_income_value(40, [0.13, 0.13, 0.13], 0.5, 0.10, 0.11, 0.04)
print(f"residual income value per share: {v:.2f}   price-to-book {v / 40:.2f}")

def justified_pe(payout, g, r):        # leading P/E from the Gordon model
    return payout / (r - g)

def justified_pb(roe, g, r):
    return (roe - g) / (r - g)

for roe in (0.08, 0.10, 0.14, 0.20):
    g = 0.04
    payout = 1 - g / roe                # sustainable growth g = ROE x retention
print(f"ROE {roe:.0%}: justified P/B {justified_pb(roe, g, 0.10):.2f}, leading P/E {justified_pe(payout, g, 0.10):.1f}")residual income value per share: 49.22 price-to-book 1.23 ROE 8%: justified P/B 0.67, leading P/E 8.3 ROE 10%: justified P/B 1.00, leading P/E 10.0 ROE 14%: justified P/B 1.67, leading P/E 11.9 ROE 20%: justified P/B 2.67, leading P/E 13.3
The table produced by the code makes a key point. When a company earns exactly its cost of equity, here 10 %, its justified price-to-book ratio is 1 and its P/E is the same whatever its growth: growth adds no value unless the company earns more than its cost of capital on the money it reinvests. When ROE is below the cost of equity, growth destroys value and the company should be worth less than book value.
Multiples and comparables
In practice, most equity valuations rely on multiples of comparable companies: a price-to-earnings ratio, an enterprise-value-to-EBITDA ratio, a price-to-book ratio or a price-to-sales ratio. Multiples are quick and use the market's own judgment, but they assume the comparable companies are correctly priced and truly comparable in growth, risk and accounting. The justified multiples above show what a multiple should depend on. A higher P/E is justified by faster growth, a higher payout for the same growth (meaning more efficient investment) and lower risk; a higher price-to-book by a higher return on equity. The PEG ratio, P/E divided by expected growth in percentage points, is a rough way to compare companies growing at different rates, but it ignores risk and the duration of growth.
| Multiple | Best suited to | Main drivers | Common pitfalls |
|---|---|---|---|
| Price-to-earnings | Profitable, stable companies | Growth, payout, risk | Distorted by one-time items and cyclical peaks |
| EV-to-EBITDA | Comparing firms with different leverage | Growth, capital intensity, risk | Ignores capital spending and taxes |
| Price-to-book | Banks, insurers, asset-heavy firms | Return on equity versus cost of equity | Book values differ by accounting and age of assets |
| Price-to-sales | Young companies with no profits | Margins, growth | Says nothing about profitability |
Reading expectations from prices
Instead of forecasting and computing a value, an analyst can run the models backward and ask what the current price implies. If a share trades at 30 times earnings and the cost of equity is 9 %, the Gordon-model relationship implies the growth rate the market must be expecting; if that growth looks implausible given the industry, the price may be too high. Applied to a whole market, the same logic gives the implied equity risk premium: the expected return that equates the index level with forecast dividends and buybacks, minus the risk-free rate. Aswath Damodaran publishes such estimates for the US market, which have mostly ranged between about 4 % and 6 % in recent decades. Implied estimates are forward-looking and move with market levels, so they complement the historical averages used in FIN-201.
Worked problem
What growth does the price imply?
A share trades at $60. Next year's dividend is expected to be $1.80 and the cost of equity is 8.5 %. What constant growth rate does the price imply?
Show solution
- From the Gordon model, P = D1 ÷ (r − g), so g = r − D1 ÷ P.
- g = 0.085 − 1.80 ÷ 60 = 0.085 − 0.030 = 5.5 %.
Answer: The market expects dividends to grow about 5.5 % a year forever, faster than nominal economic growth of perhaps 4 %. The analyst must decide whether that is reasonable.
Analysts, forecasts and conflicts
Sell-side analysts at investment dealers publish earnings forecasts and recommendations; buy-side analysts work for fund managers. Research has long found that sell-side forecasts are on average too optimistic, especially for longer horizons, and that buy recommendations far outnumber sell recommendations, partly because of conflicts with investment banking business. Rules adopted in both countries after the early-2000s research scandals require disclosure of conflicts and separation of research from banking. Analysts' forecast revisions still move prices, and studies find some value in them, but investors should treat consensus forecasts as one input among several, not as truth.
Common mistakes
MistakeA company growing faster always deserves a higher multiple.
InsteadGrowth adds value only if the return on reinvested capital exceeds the cost of capital.
MistakeA low P/E means a share is cheap.
InsteadIt may reflect low growth, high risk, poor earnings quality or a cyclical peak in earnings.
MistakeThe residual income model needs dividends.
InsteadIt works from book value and earnings, so it suits companies that pay no dividends.
MistakeNet income is the best measure of performance.
InsteadHigh accruals relative to cash flow can signal low earnings quality.
MistakeConsensus analyst forecasts are unbiased.
InsteadSell-side forecasts have historically been optimistic on average.
Summary and key terms
- Top-down analysis moves from the economy to the industry to the company.
- Cyclical, defensive and rate-sensitive sectors respond differently to the business cycle.
- Earnings quality matters; large accruals relative to cash flow are a warning sign.
- Residual income value = book value + PV of earnings above the cost of equity on book value.
- Justified P/B = (ROE − g) ÷ (r − g); growth adds value only when ROE exceeds r.
- Multiples are quick but depend on truly comparable firms; each has its own pitfalls.
- Models can be run backward to reveal the growth or risk premium implied by market prices.
- Top-down analysis
- Analysis that starts with the economy and moves to industries and companies.
- Cyclical industry
- An industry whose sales and profits are highly sensitive to the business cycle.
- Defensive industry
- An industry whose sales and profits are relatively insensitive to the business cycle.
- Sector rotation
- Shifting investments among sectors in anticipation of the business cycle.
- Earnings quality
- The extent to which reported earnings reflect sustainable cash-generating performance.
- Accruals
- The difference between net income and operating cash flow.
- Residual income
- Earnings minus a charge for the cost of equity on beginning book value.
- Clean surplus relation
- The accounting identity that book value changes only by earnings less dividends.
- Justified multiple
- A valuation multiple derived from a company's fundamentals.
- Implied equity risk premium
- The market risk premium inferred from current prices and expected cash flows.
Practice problems
Work each problem on paper first, then reveal the answer to check.
Book value $25, ROE 15 %, r = 10 %, g = 5 % forever. Justified P/B and value?
Show answer
(0.15 − 0.05) ÷ (0.10 − 0.05) = 2.0; value $50.
A company earns ROE of 8 % with r = 10 %. Should it grow by reinvesting more?
Show answer
No; reinvesting below the cost of equity destroys value.
Year-1 earnings $4 on beginning book value $30, r = 10 %. Residual income?
Show answer
4 − 3 = $1.
Payout 40 %, g = 5 %, r = 9 %. Justified leading P/E?
Show answer
0.40 ÷ 0.04 = 10.
P/E 25, expected growth 12 %. PEG ratio?
Show answer
25 ÷ 12 = 2.08.
Price $80, D1 = $2.40, r = 8 %. Implied growth?
Show answer
0.08 − 0.03 = 5 %.
Net income $500 million, operating cash flow $200 million. What might concern an analyst?
Show answer
Large accruals may signal low earnings quality.
Which multiple suits a young company with no profits?
Show answer
Price-to-sales or EV-to-sales.
Name a defensive and a cyclical sector.
Show answer
Defensive: utilities or consumer staples. Cyclical: autos, materials or industrials.
Portfolio task: download one US bank's latest Form 10-K from EDGAR and compute its return on equity and price-to-book ratio.
Show answer
Answers vary; show the figures used and the date of the price.
Lesson quiz · 5 questions
Score 60% or more to complete this lesson.
Create a free account to save your progress, take quizzes and earn a certificate.