
FIN-201 · Lesson 7 of 12 · 34 min
Capital budgeting decision rules
Capital budgeting decisions shape a firm for years: which plants to build, which products to launch, which machines to replace, which acquisitions to pursue. Lesson 1 argued that the goal is to maximize the value of the firm, and lessons 3 to 6 built the tools for valuing cash flows. This lesson asks which decision rule turns those tools into the right choices. BUS-110 lesson 10 introduced net present value, the internal rate of return, payback and the profitability index for a single delivery van. Here the focus is on why NPV is the benchmark, the situations in which the other rules give wrong answers, and how to handle common complications: mutually exclusive projects, projects with different lives and limited capital. Lessons 8 and 9 deal with estimating the cash flows and their risk.
Net present value
A project's net present value is the present value of its expected cash flows, discounted at the opportunity cost of capital for projects of that risk, minus its initial cost. If NPV is positive, the project is expected to return more than investors could earn elsewhere at the same risk, so accepting it adds value to the firm equal to the NPV. If NPV is negative, the firm's owners would be better off if the money were returned to them. The rule is simple: accept projects with positive NPV, and among mutually exclusive alternatives choose the one with the highest NPV.
NPV has properties no other rule shares. It uses all the cash flows, discounts them at the market's opportunity cost of capital, and measures value in dollars. NPVs add: the value of two projects together equals the sum of their separate NPVs, so a bad project cannot be disguised by bundling it with a good one, and the value of the firm is the sum of the values of its projects. And NPV depends only on the project's cash flows and the cost of capital, not on managers' preferences, accounting choices or the firm's other activities.
The internal rate of return
The internal rate of return (IRR) is the discount rate at which a project's NPV is zero. The IRR rule accepts projects whose IRR exceeds the cost of capital. For a conventional project, one with an initial outflow followed by inflows, NPV falls as the discount rate rises, so IRR and NPV give the same accept-or-reject answer: if the IRR is above the cost of capital, the NPV at the cost of capital is positive. Managers like the IRR because a percentage is easy to communicate and compare with a hurdle rate. But it has four well-known pitfalls.
First, lending or borrowing. A project that brings in cash first and pays out later, such as a customer prepayment or a loan received, has an NPV that rises with the discount rate. A high IRR is then bad, not good, because it is the rate you are paying. Second, multiple IRRs. If cash flows change sign more than once, as in a mine that requires a large clean-up cost at the end or a project needing a major overhaul midway, there can be two or more IRRs, or none. Third, mutually exclusive projects. A small project can have a higher IRR but a lower NPV than a large one, and a project with quick payoffs can beat a project with distant payoffs on IRR while losing on NPV. Fourth, a term structure: when the cost of capital differs by year, there is no single hurdle rate to compare an IRR with.
Worked problem
Multiple internal rates of return
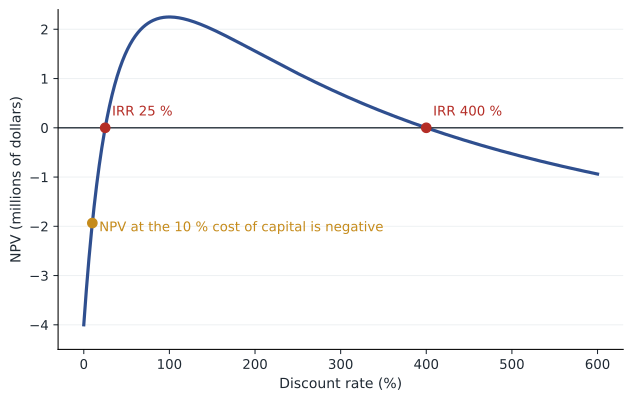
A mining project costs $4 million today, produces $25 million next year, and then requires $25 million of reclamation spending in year 2. The cost of capital is 10 %. Find the NPV and the IRRs.
Show solution
- NPV at 10 % = −4 + 25 ÷ 1.10 − 25 ÷ 1.10² = −4 + 22.727 − 20.661 = −1.934 (million).
- Set NPV = 0: with x = 1 ÷ (1 + r), −4 + 25x − 25x² = 0, so 25x² − 25x + 4 = 0.
- x = 0.8 or x = 0.2, giving r = 25 % or r = 400 %.
Answer: The project has two IRRs, 25 % and 400 %, both above the 10 % cost of capital, yet its NPV at 10 % is negative. The IRR rule is useless here; NPV gives the right answer.
# NPV profile of the mining project and a scan for internal rates of return
flows = [-4, 25, -25]
def npv(rate, cfs):
    return sum(cf / (1 + rate) ** t for t, cf in enumerate(cfs))

for r in (0.0, 0.10, 0.25, 0.60, 1.00, 2.00, 4.00, 6.00):
    print(f"rate {r:5.0%}: NPV {npv(r, flows):7.3f}")
roots, prev = [], npv(0.0, flows)
for k in range(1, 6001):
    r = k / 1000
    cur = npv(r, flows)
    if prev * cur <= 0:
        roots.append(round(r, 3))
    prev = cur
print("IRRs found:", roots)rate 0%: NPV -4.000 rate 10%: NPV -1.934 rate 25%: NPV 0.000 rate 60%: NPV 1.859 rate 100%: NPV 2.250 rate 200%: NPV 1.556 rate 400%: NPV 0.000 rate 600%: NPV -0.939 IRRs found: [0.25, 0.251, 4.0, 4.001]
Mutually exclusive projects
When a firm must choose between projects, because they use the same site, the same budget or serve the same need, ranking by IRR can mislead. The reason is that IRR is a rate, not an amount of value, and it implicitly assumes intermediate cash flows can be reinvested at the IRR itself. NPV assumes reinvestment at the cost of capital, which is the market's actual opportunity rate. When the two rankings conflict, NPV is right. One way to use IRR correctly is to look at the incremental cash flows, the difference between the larger and smaller project: if the IRR of the increment exceeds the cost of capital, the larger project is better.
Worked problem
Choosing between two projects
Project S costs $10,000 and returns $12,500 in one year. Project L costs $50,000 and returns $59,000 in one year. They are mutually exclusive and the cost of capital is 10 %. Compare IRRs, NPVs and the incremental IRR.
Show solution
- IRR of S = 25 %; IRR of L = 18 %.
- NPV of S = −10,000 + 12,500 ÷ 1.10 = 1,363.64.
- NPV of L = −50,000 + 59,000 ÷ 1.10 = 3,636.36.
- Increment L − S: costs 40,000, returns 46,500; incremental IRR = 16.25 %, above 10 %.
Answer: S has the higher IRR, but L adds $2,273 more value. The incremental IRR confirms that the extra $40,000 invested in L earns more than the cost of capital.
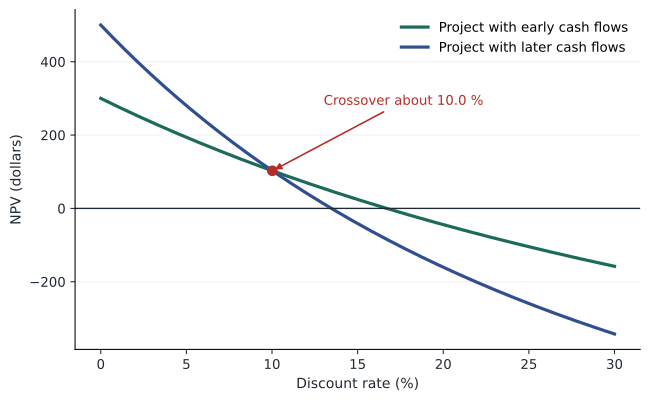
The figure shows the timing version of the problem. A project whose cash flows arrive late has a steep NPV profile, because distant cash flows are hit hard by higher discount rates. Below the crossover rate, the rate at which the two NPVs are equal, the late project has the higher NPV; above it, the early project wins. The IRR ranking corresponds to the comparison at high discount rates, which is irrelevant if the firm's cost of capital is below the crossover.
The modified internal rate of return
The modified IRR (MIRR) addresses the reinvestment and multiple-root problems by compounding all inflows forward to the end of the project at the cost of capital, discounting all outflows back to today at the cost of capital, and then finding the single rate that links the two. It always gives a unique answer and ranks independent projects consistently with NPV, though it can still rank projects of different size differently. Many firms report MIRR alongside NPV for communication; it adds no information that NPV does not already contain.
Worked problem
Calculating MIRR
A project costs $100,000 and returns $30,000, $50,000 and $60,000 at the end of years 1 to 3. The cost of capital is 9 %. Find the NPV, IRR and MIRR.
Show solution
- NPV = −100,000 + 27,522.94 + 42,084.00 + 46,331.01 = 15,937.94.
- IRR (by trial) ≈ 16.79 %.
- FV of inflows at 9 % = 30,000 × 1.09² + 50,000 × 1.09 + 60,000 = 35,643 + 54,500 + 60,000 = 150,143.
- MIRR = (150,143 ÷ 100,000)^(1/3) − 1 = 14.51 %.
Answer: The MIRR is lower than the IRR because it assumes reinvestment at 9 % rather than at 16.79 %. All three measures say accept.
Payback and discounted payback
The payback period is the time it takes for a project's cash inflows to recover its initial cost. It is simple and widely used as a screen, particularly by smaller firms and for risky projects in volatile markets, because it favors projects that return cash quickly. But it ignores the time value of money within the payback period (discounted payback fixes that), ignores all cash flows after the cutoff, and the cutoff itself is arbitrary. A project that pays back in three years and then stops can beat one that pays back in four years and then produces large cash flows for twenty more. Payback is best treated as a rough indicator of liquidity and risk, not as a decision rule.
Capital rationing and the profitability index
In theory, a firm that can raise money in competitive markets should take every positive-NPV project. In practice, many firms impose a budget limit, either because senior managers want to control the growth of divisions and discipline optimistic forecasts (soft rationing), or because the firm genuinely cannot raise more funds on reasonable terms (hard rationing). When capital is limited, the goal becomes maximizing the total NPV from the projects that fit within the budget. The profitability index, the present value of future cash flows divided by the initial investment, or equivalently NPV per dollar invested, ranks projects by value created per unit of the scarce resource.
Worked problem
Choosing projects under a budget
A firm has $1,000,000 to invest this year and these independent projects: A costs $400,000 with NPV $120,000; B costs $600,000 with NPV $150,000; C costs $300,000 with NPV $105,000; D costs $300,000 with NPV $60,000. Which should it choose?
Show solution
- NPV per dollar: A 0.30, B 0.25, C 0.35, D 0.20.
- Rank by NPV per dollar: C, A, B, D.
- Take C (300,000) and A (400,000): 700,000 used, NPV 225,000. B does not fit; D fits: total 1,000,000, NPV 285,000.
- Check the alternative A + B: 1,000,000, NPV 270,000. C + A + D is better.
Answer: Ranking by NPV per dollar works well here, but with indivisible projects it is a heuristic; checking feasible combinations, or using integer programming for many projects, confirms the best set.
Projects with different lives
Choosing between machines that do the same job but last different lengths of time requires care, because a machine that lasts longer saves the firm from replacing it sooner. If the machine will be replaced repeatedly, compare the equivalent annual cost: the level annual payment with the same present value as the machine's costs over its life. It converts each machine's lifetime cost into a cost per year that can be compared directly, assuming each can be replaced on the same terms.
Worked problem
Equivalent annual cost
Machine X costs $60,000 and $8,000 a year to run for 3 years. Machine Y costs $90,000 and $6,000 a year to run for 5 years. The cost of capital is 8 % and either machine would be replaced at the end of its life. Which is cheaper?
Show solution
- PV of X = 60,000 + 8,000 × 2.5771 = 80,616.78; EAC = 80,616.78 ÷ 2.5771 = 31,282.01.
- PV of Y = 90,000 + 6,000 × 3.9927 = 113,956.26; EAC = 113,956.26 ÷ 3.9927 = 28,541.08.
Answer: Machine Y has the higher total present value of costs, but over a long horizon it costs about $2,741 a year less. Comparing raw present values would choose the wrong machine.
What firms actually use
Surveys of chief financial officers in North America, beginning with Graham and Harvey's study published in 2001 and repeated in later work, find that most large firms use NPV and IRR, often together, and many also look at payback, especially smaller firms. That is sensible if the rules are used together intelligently: NPV for the decision, IRR for communication, payback as a check on how long capital is at risk. The danger is in relying on IRR or payback alone in exactly the situations where they fail. Whatever the rule, the quality of the decision depends mostly on the quality of the cash flow forecasts and the discount rate, the subjects of the next lessons.
| Rule | Strengths | Weaknesses | Use |
|---|---|---|---|
| NPV | Measures value added in dollars; additive; uses all cash flows and the opportunity cost of capital | Requires a discount rate; harder to communicate | The decision rule |
| IRR | Intuitive percentage; no need to specify the rate in advance | Multiple or no roots; wrong for borrowing-type flows and mutually exclusive projects | Communication; use incremental IRR to compare |
| MIRR | Unique; consistent reinvestment assumption | Still a rate; can mis-rank projects of different size | Communication alongside NPV |
| Payback | Simple; signals liquidity and early risk | Ignores time value and later cash flows; arbitrary cutoff | Screening only |
| Profitability index | Ranks value per dollar when capital is limited | Can mislead with indivisible projects or multi-period limits | Capital rationing |
Common mistakes
MistakeChoose the project with the highest IRR.
InsteadAmong mutually exclusive projects, choose the highest NPV; IRR ignores scale and timing.
MistakeA project with two IRRs above the cost of capital must be good.
InsteadWith non-conventional cash flows, check the NPV at the cost of capital directly.
MistakePayback tells you whether a project adds value.
InsteadPayback ignores time value and cash flows after the cutoff.
MistakeA longer-lived machine is worse because its total cost is higher.
InsteadCompare equivalent annual costs when machines are replaced repeatedly.
MistakeUnder capital rationing, rank projects by NPV.
InsteadRank by NPV per dollar of the scarce resource, then check feasible combinations.
Summary and key terms
- NPV measures the value a project adds; accept positive-NPV projects and choose the highest NPV among exclusive alternatives.
- IRR agrees with NPV for single conventional projects but fails for borrowing-type, non-conventional and mutually exclusive projects.
- Incremental IRR and MIRR can be used to make rate-based comparisons consistent with NPV.
- Payback and discounted payback are screens, not decision rules.
- Under capital rationing, maximize total NPV within the budget; the profitability index helps rank projects.
- Compare machines with different lives using equivalent annual cost.
- Most firms use NPV and IRR together; good forecasts matter more than the choice of rule.
- Net present value
- The present value of a project's cash flows minus its cost.
- Internal rate of return
- The discount rate at which a project's NPV is zero.
- Hurdle rate
- The minimum acceptable return, normally the cost of capital.
- Mutually exclusive projects
- Alternatives of which only one can be chosen.
- Incremental IRR
- The IRR of the difference in cash flows between two projects.
- Crossover rate
- The discount rate at which two projects have equal NPVs.
- Modified IRR
- The rate that equates outflows discounted at the cost of capital with inflows compounded at the cost of capital.
- Payback period
- The time needed for cash inflows to recover the initial investment.
- Profitability index
- PV of future cash flows divided by initial investment, or NPV per dollar invested.
- Equivalent annual cost
- The level annual cost with the same present value as an asset's lifetime costs.
Practice problems
Work each problem on paper first, then reveal the answer to check.
Cost $50,000; inflows $20,000 a year for 3 years; r = 8 %. NPV?
Show answer
−50,000 + 51,541.94 = 1,541.94.
IRR of the same project?
Show answer
About 9.70 %.
Why can a project have two IRRs?
Show answer
Its cash flows change sign more than once.
A firm receives $10,000 now and pays $11,500 in one year. IRR 15 %. Accept at r = 10 %?
Show answer
No: it is borrowing at 15 %; NPV = 10,000 − 10,454.55 = −454.55.
Projects: S (−1,000, +1,300), L (−5,000, +6,000), r = 10 %. Which is better?
Show answer
L: NPV 454.55 versus 181.82.
MIRR of −1,000 now, +600 and +600 in years 1 and 2 at r = 10 %?
Show answer
FV = 1,260; MIRR = √1.26 − 1 = 12.25 %.
Payback of −40,000 then +15,000 a year?
Show answer
2.67 years.
Budget $500,000; A costs 300,000 NPV 90,000; B costs 200,000 NPV 70,000; C costs 500,000 NPV 140,000. Best choice?
Show answer
A + B: NPV 160,000.
Machine costs $40,000, runs 4 years at $5,000 a year, r = 10 %. EAC?
Show answer
PV 55,849.33; EAC 17,618.83.
Portfolio task: build an NPV profile in a spreadsheet for a project with a sign change and find all its IRRs.
Show answer
Answers vary; plot NPV against rates from 0 % to several hundred percent.
Lesson quiz · 5 questions
Score 60% or more to complete this lesson.
Create a free account to save your progress, take quizzes and earn a certificate.