
FIN-201 · Lesson 2 of 12 · 29 min
Financial statements, cash flow and financial analysis
Financial decisions are about cash: cash invested, cash returned, and the timing and risk of both. Accounting statements are the main source of information about a firm's cash flows, but they are prepared for other purposes, such as measuring profit period by period and reporting to tax authorities and lenders. This lesson shows how a financial manager reads the balance sheet, income statement and statement of cash flows, how to extract free cash flow, the measure that drives valuation, and how ratios summarize liquidity, leverage, efficiency, profitability and market value. It assumes the bookkeeping and statement preparation covered in ACCT-101 and concentrates on what finance does with the numbers.
Accounting standards
US public companies report under US generally accepted accounting principles (US GAAP), set by the Financial Accounting Standards Board (FASB) and codified in the Accounting Standards Codification; the SEC accepts IFRS from foreign private issuers. Private companies often use US GAAP with simplifications from the Private Company Council, or a tax or cash basis. Differences between US GAAP and IFRS affect items such as inventory (LIFO is allowed only under US GAAP), development costs and asset revaluations, so analysts check the framework before comparing companies.
Book values and market values
The balance sheet lists assets at book value, mostly historical cost less depreciation, and the shareholders' equity figure is simply what is left after subtracting liabilities. Market values can differ enormously. A software company may have few physical assets but a market value many times its book equity because investors expect large future cash flows from its products, people and customer relationships, much of which never appears on the balance sheet. A struggling retailer may trade below book value because its stores are worth less than their recorded cost. For financial decisions, market values matter: a firm's cost of capital and its capital structure are measured at market value wherever possible, and the market-to-book ratio is a quick indicator of how much value investors see beyond the accounts.
Profit is not cash flow
Net income is measured on an accrual basis. Revenue is recognized when goods or services are delivered, not when the customer pays; expenses are matched to revenue, so the cost of a machine is spread over its life as depreciation rather than charged when the machine is bought. These conventions make income a better measure of performance from one period to the next, but they mean income and cash flow diverge. A fast-growing firm can report rising profits while its bank balance falls, because its receivables and inventory are absorbing cash and its capital spending exceeds depreciation. The statement of cash flows reconciles the two by starting with net income, adding back non-cash charges such as depreciation, and adjusting for changes in working capital, investment and financing.
Free cash flow
For valuation and capital budgeting, finance focuses on free cash flow (FCF): the cash generated by the firm's operations after the taxes it would pay if it had no debt, after the investment needed in fixed assets and working capital, and before any payments to lenders or shareholders. It is free in the sense that it is available to be distributed to all the firm's investors. Interest is excluded because the cost of debt is handled in the discount rate, as lesson 11 shows; including it in the cash flows as well would count it twice.
Here EBIT is earnings before interest and taxes, \( T \) the corporate tax rate, and \( \Delta NWC \) the increase in net working capital (current operating assets such as receivables and inventory minus current operating liabilities such as payables). The term \( EBIT(1-T) \) is sometimes called net operating profit after tax (NOPAT). Free cash flow can be negative for a growing firm that is investing heavily; that is not necessarily bad, provided the investments are worth more than they cost.
Worked problem
Calculating free cash flow
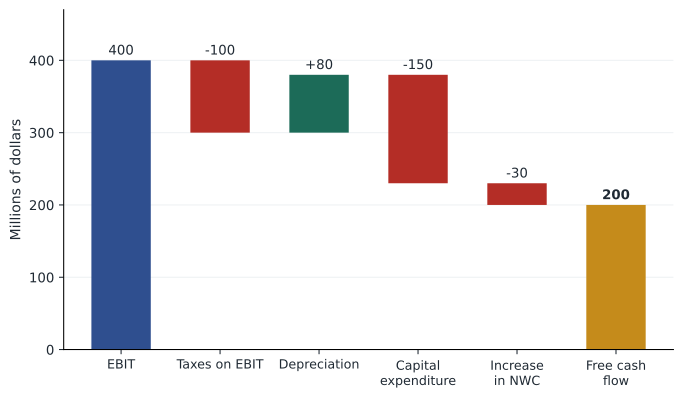
A company reports EBIT of $400 million, depreciation of $80 million and capital expenditure of $150 million. Net working capital rose from $220 million to $250 million. The tax rate is 25 %. Find NOPAT and free cash flow.
Show solution
- NOPAT = 400 × (1 − 0.25) = 300.
- Change in NWC = 250 − 220 = 30.
- FCF = 300 + 80 − 150 − 30 = 200.
Answer: Free cash flow is $200 million, which is available to pay interest, repay debt, pay dividends or buy back shares.
Free cash flow must go somewhere. The cash flow identity says that cash flow from the firm's assets equals cash flow to its creditors plus cash flow to its shareholders. Cash flow to creditors is interest paid (after the tax saving it generates) minus net new borrowing; cash flow to shareholders is dividends plus share buybacks minus new equity raised. If a firm generates $200 million of free cash flow, pays $40 million of after-tax interest, repays $60 million of debt and pays $100 million in dividends, the identity balances: 200 = (40 + 60) + 100. If it has more cash than it can use, it can pay it out; if it has less, it must borrow or issue shares.
# Free cash flow and where it goes (millions)
ebit, tax, dep, capex = 400, 0.25, 80, 150
nwc_start, nwc_end = 220, 250
nopat = ebit * (1 - tax)
fcf = nopat + dep - capex - (nwc_end - nwc_start)
print(f"NOPAT {nopat:.0f}  FCF {fcf:.0f}")
after_tax_interest, debt_repaid, dividends, buybacks, new_equity = 40, 60, 70, 30, 0
to_creditors = after_tax_interest + debt_repaid
to_shareholders = dividends + buybacks - new_equity
print(f"to creditors {to_creditors}, to shareholders {to_shareholders}, total {to_creditors + to_shareholders}")NOPAT 300 FCF 200 to creditors 100, to shareholders 100, total 200
Average and marginal tax rates
Financial decisions use the marginal tax rate, the rate paid on the next dollar of income, because that is the rate that applies to the extra income from a new project. Since 2018 the US federal corporate income tax has been a flat 21 %, so a C corporation's federal marginal and average rates are the same, but state corporate income taxes add more; a common combined figure used in examples is about 25 %. Pass-through businesses such as S corporations and LLCs are taxed at the owners' personal rates instead. Rates vary by state and should be checked for the year in question.
Financial ratios
Ratios compress financial statements into numbers that can be compared over time and across firms of different sizes. No single ratio tells the whole story; the point is to ask good questions. Ratios fall into five families. Liquidity ratios, such as the current ratio (current assets divided by current liabilities) and the quick ratio (excluding inventory), measure the ability to pay short-term obligations. Leverage ratios, such as debt to equity, debt to capital and times interest earned (EBIT divided by interest), measure reliance on debt and the cushion for paying interest. Efficiency ratios, such as asset turnover, inventory turnover and days sales outstanding, measure how intensively assets are used. Profitability ratios, such as profit margin, return on assets (ROA) and return on equity (ROE), measure returns. Market value ratios, such as the price-earnings ratio, the market-to-book ratio and enterprise value to EBITDA, compare the market's valuation with accounting numbers.
| Ratio | Formula | What it suggests |
|---|---|---|
| Current ratio | Current assets ÷ current liabilities | Short-term liquidity |
| Times interest earned | EBIT ÷ interest expense | Ability to meet interest from operating profit |
| Debt to capital | Debt ÷ (debt + equity) | Financial leverage |
| Days sales outstanding | Receivables ÷ (sales ÷ 365) | How quickly customers pay |
| Return on equity | Net income ÷ shareholders' equity | Return to owners on book equity |
| Price-earnings ratio | Share price ÷ earnings per share | How much investors pay per dollar of earnings |
| EV/EBITDA | (Market value of equity + debt − cash) ÷ EBITDA | Valuation of the whole firm relative to operating earnings |
The DuPont identity breaks return on equity into three drivers: how much profit the firm earns per dollar of sales, how many dollars of sales it generates per dollar of assets, and how many dollars of assets it finances per dollar of equity. It shows that a high ROE can come from good margins, efficient use of assets, or simply more borrowing, and the last of these also raises risk.
Worked problem
DuPont analysis
Firm A has a profit margin of 4 %, asset turnover of 2.5 and an equity multiplier (assets ÷ equity) of 1.5. Firm B has a margin of 10 %, turnover of 0.8 and an equity multiplier of 2.5. Compare their ROEs and explain the difference.
Show solution
- ROE of A = 0.04 × 2.5 × 1.5 = 0.15, or 15 %.
- ROE of B = 0.10 × 0.8 × 2.5 = 0.20, or 20 %.
- A is a high-volume, low-margin business with little debt; B earns higher margins on a heavier asset base and uses much more leverage.
Answer: B's higher ROE comes largely from leverage, which magnifies both good and bad years. ROE alone does not show whether B is the better business.
Working capital and the cash conversion cycle
Net working capital ties up cash. A firm buys inventory, holds it until it is sold, then waits for customers to pay, while it delays paying its own suppliers for as long as is reasonable. The cash conversion cycle measures the number of days between paying suppliers and collecting from customers: days of inventory plus days of receivables minus days of payables. A shorter cycle frees cash; a growing firm with a long cycle needs financing just to stand still. CON-320 applies these ideas to contractors, whose holdbacks or retainage lengthen the cycle; this course returns to working capital as part of project cash flows in lesson 8.
Worked problem
The cash conversion cycle
A distributor has annual sales of $36.5 million and cost of goods sold of $29.2 million. It holds inventory of $4.0 million, receivables of $5.0 million and payables of $2.4 million. Find its cash conversion cycle, and the cash released if it cuts receivable days by 10.
Show solution
- Days inventory = 4.0 ÷ (29.2 ÷ 365) = 4.0 ÷ 0.08 = 50 days.
- Days receivables = 5.0 ÷ (36.5 ÷ 365) = 5.0 ÷ 0.1 = 50 days.
- Days payables = 2.4 ÷ 0.08 = 30 days.
- CCC = 50 + 50 − 30 = 70 days.
- Cutting receivable days by 10 releases 10 × 0.1 = $1.0 million of cash.
Answer: The firm finances 70 days of operations. Faster collection would release $1 million, cash it could invest or use to repay debt.
Limits of accounting data
Ratios and statements are a starting point. Accounting choices, such as depreciation methods, revenue recognition and lease treatment, differ between firms and standards. One-time items distort comparisons. EBITDA, popular because it approximates operating cash flow, ignores the capital spending needed to replace worn assets and the cash tied up in working capital, and it is not defined by accounting standards, so companies calculate it differently. Book values can be far from market values. And a ratio is only meaningful against a benchmark: the firm's own history, its competitors, or industry averages. Financial analysis is best seen as a way to find questions to ask management, not as a substitute for understanding the business.
Common mistakes
MistakeNet income is the cash the firm generated.
InsteadAccrual accounting separates income from cash; free cash flow adjusts for non-cash charges, investment and working capital.
MistakeInterest should be subtracted when calculating free cash flow for valuing the firm.
InsteadFree cash flow is measured before financing; the cost of debt enters through the discount rate.
MistakeNegative free cash flow means a firm is failing.
InsteadA growing firm investing in positive-NPV projects can have negative free cash flow.
MistakeA higher ROE always means a better-run firm.
InsteadROE can be raised by leverage, which increases risk; DuPont analysis shows the source.
MistakeBook equity tells you what the shares are worth.
InsteadMarket value reflects expected future cash flows and can differ greatly from book value.
Summary and key terms
- Finance cares about cash flows, their timing and their risk; accounting statements are the main source of information but use accrual conventions.
- Market values, not book values, are relevant for financial decisions.
- Free cash flow = EBIT(1 − T) + depreciation − capital expenditure − increase in net working capital.
- Cash flow from assets equals cash flow to creditors plus cash flow to shareholders.
- Use marginal, not average, tax rates for decisions.
- Ratios measure liquidity, leverage, efficiency, profitability and market value; DuPont analysis splits ROE into margin, turnover and leverage.
- The cash conversion cycle measures how long cash is tied up in operations.
- Free cash flow
- Operating cash flow after taxes on EBIT and after investment in fixed assets and working capital, available to all investors.
- NOPAT
- Net operating profit after tax, EBIT × (1 − T).
- Net working capital
- Current operating assets minus current operating liabilities.
- Market-to-book ratio
- Market value of equity divided by book value of equity.
- Enterprise value
- Market value of equity plus debt minus cash; the value of the operating business.
- EBITDA
- Earnings before interest, taxes, depreciation and amortization.
- Marginal tax rate
- The tax rate on the next dollar of income.
- DuPont identity
- ROE = profit margin × asset turnover × equity multiplier.
- Cash conversion cycle
- Days inventory plus days receivables minus days payables.
- Times interest earned
- EBIT divided by interest expense.
Practice problems
Work each problem on paper first, then reveal the answer to check.
EBIT is 250, tax rate 26 %, depreciation 40, capex 70, NWC rises by 15. Find FCF.
Show answer
185 + 40 − 70 − 15 = 140.
Why is interest excluded from free cash flow?
Show answer
Because financing costs are captured in the discount rate; including them would double count.
A firm has FCF of 120, pays after-tax interest of 20, borrows 30 more and pays dividends of 60. What else must have happened?
Show answer
Cash to shareholders must be 120 − (20 − 30) = 130, so buybacks or other payouts of 70.
Profit margin 6 %, asset turnover 1.2, equity multiplier 2. Find ROE.
Show answer
14.4 %.
Current assets 900, current liabilities 600. Current ratio?
Show answer
1.5.
EBIT 300, interest 50. Times interest earned?
Show answer
6 times.
Sales 730, receivables 80. Days sales outstanding?
Show answer
80 ÷ 2 = 40 days.
Days inventory 45, days receivables 35, days payables 40. CCC?
Show answer
40 days.
Give two reasons EBITDA can mislead.
Show answer
Ignores capital spending and working capital; not standardized; ignores taxes and interest.
Portfolio task: download a public company's latest annual report and calculate its free cash flow and ROE.
Show answer
Answers vary; show the inputs and the source pages.
Lesson quiz · 5 questions
Score 60% or more to complete this lesson.
Create a free account to save your progress, take quizzes and earn a certificate.