
ENGG-160 · Lesson 11 of 12 · 25 min
Presentations and visual communication
Lesson 4 dealt with written documents. Much engineering communication happens face to face or through visuals: design reviews, client presentations, council meetings, public open houses, conference talks, posters and the charts that summarize test results and costs. A clear twenty-minute presentation can win approval for a project that a two-hundred-page report could not; a misleading chart can drive a bad decision. This lesson covers how to plan and structure a presentation, design slides that support rather than replace the speaker, deliver confidently and handle questions, make effective posters, choose and design honest charts, and communicate numbers and risk to audiences without technical training.
Planning a presentation
As with writing, start with the audience and the purpose. Who will be in the room, what do they already know, what do they care about, and what do you want them to think, decide or do when you finish? A design review for engineers wants assumptions, calculations and risks; a client wants options, costs and a recommendation; a public meeting wants to know what will change for them and why. Then write the single main message in one sentence. If you cannot, the presentation is not ready.
A dependable structure for engineering presentations is:
- Opening: why this matters to this audience, and the main message or recommendation, stated up front.
- Context: the problem or question, briefly.
- Body: three or so key points supporting the message, each with its evidence (results, comparisons, a demonstration).
- Close: restate the message and the decision or action you are asking for, then take questions.
Fit the content to the time. A common pace is about one slide per one or two minutes; a ten-minute design review has room for perhaps six to eight slides and three key points. Material that does not fit belongs in backup slides or a handout. Running over time is disrespectful to the audience and usually means the main message gets rushed.
Designing slides
Slides are visual aids for the speaker, not a document to be read. When the audience is reading dense text, they are not listening. Effective technical slides follow a few principles:
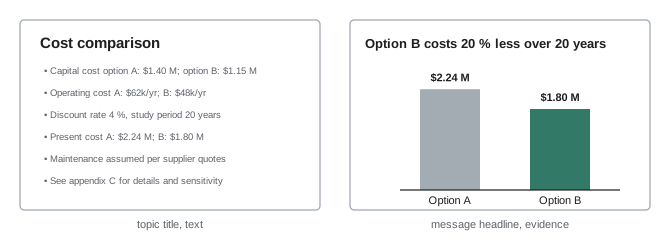
- One idea per slide, with a headline that states the point as a full sentence ("Option B costs 20 % less over 20 years") rather than a topic label ("Cost comparison"). A reader who sees only the headlines should get the argument.
- Show evidence visually: a chart, photo, drawing or diagram, sized large enough to read from the back of the room, with the speaker supplying the explanation.
- Minimal text: a few words or short phrases, not paragraphs. Use a font size of at least 24 points for body text and 18 for labels.
- High contrast and consistent layout; avoid decorative backgrounds, animations and clip art that add nothing.
- Label every axis and unit, and highlight the part of a chart that matters, with color or an annotation.
- Keep detailed tables, derivations and backup data in an appendix, ready for questions.
For technical audiences that will study the material afterwards, some organizations use a "slide document" format with more text, intended to be read rather than presented. Know which you are making, and do not present a dense document as if it were a talk.
Delivery and questions
Rehearse aloud, with a timer, at least twice, ideally once in front of colleagues who will ask hard questions. Know your opening and closing sentences well enough to deliver them without notes. Speak to the audience, not to the screen; make eye contact; pause after key points; and use the pointer sparingly. Nervousness is normal and usually invisible to the audience; preparation is the best remedy.
Questions are an opportunity to show command of the work. Listen to the whole question, repeat or paraphrase it if the room is large, and answer directly and briefly. If you do not know, say so and commit to finding out, then follow up. If a question challenges your conclusion, acknowledge the point, explain your reasoning and, if the challenge is right, say so; credibility is built by honesty, not by never conceding anything. Anticipate the hardest likely questions while rehearsing and prepare backup slides for them.
Team presentations need a plan for who presents what, smooth handovers, and agreement on who answers which kinds of questions. A presentation in which every member appears for one slide, without a coherent story, is weaker than one with fewer speakers who each develop a section.
Posters
Posters are common at conferences, design fairs and capstone showcases. Viewers walk past and decide in a few seconds whether to stop, so a poster needs a clear, large title that states the main finding, a visual hierarchy that leads the eye (often in columns, top to bottom), large figures with short captions, and very little text: a viewer should grasp the main point from three meters away and the supporting evidence from one meter. Prepare a one-minute spoken summary for visitors who stop, and a longer version for those who stay.
Choosing the right chart
Charts turn numbers into patterns the eye can grasp, but only if the chart type matches the message:
| Message | Good chart types |
|---|---|
| Comparing amounts across categories | Bar chart (horizontal if labels are long) |
| Change over time | Line chart |
| Relationship between two variables | Scatter plot, with a fitted line if appropriate |
| Distribution of values | Histogram or box plot |
| Parts of a whole (few parts) | Stacked bar or, sparingly, a pie chart |
| Exact values for reference | Table |
| Schedule | Gantt chart |
The statistician and designer Edward Tufte argued for maximizing the "data-ink ratio": every mark on a chart should convey information. Remove heavy gridlines, borders, 3D effects, shadows and decorative fills; label data directly rather than relying on a legend where possible; and order categories meaningfully (by size, or in a natural sequence) rather than alphabetically. Use color purposefully, to highlight what matters or distinguish a few series, and make sure charts still work for the roughly 8 % of men with color vision deficiency, for example by avoiding red–green contrasts alone and using line styles or direct labels as well.
Honest charts
Charts can mislead, sometimes deliberately, more often by accident. Common distortions include:
- Truncated axes on bar charts. Bar length encodes value, so a bar chart's axis must start at zero; starting it higher exaggerates differences. (Line charts may use a non-zero axis, because they encode change by slope and position, but the choice should be clear.)
- Inconsistent scales between charts that will be compared, or two different y-axes on one chart that imply a relationship that may not exist.
- 3D effects and perspective, which distort the apparent size of bars and pie slices.
- Area or volume symbols scaled by height, so a value twice as large looks four or eight times larger.
- Cherry-picked time ranges that hide context.
# 1. How much does a truncated axis exaggerate a difference? (Tufte lie factor)
a, b = 96.0, 98.0                     # two efficiencies, percent
for axis_min in [0, 90, 95]:
    bar_a, bar_b = a - axis_min, b - axis_min        # drawn bar lengths
    visual = (bar_b - bar_a) / bar_a                 # change the eye sees
    data = (b - a) / a                               # actual change
    print(f"Axis from {axis_min:3d}: bar B looks {visual:6.1%} longer than A; lie factor {visual / data:5.1f}")

# 2. Relative and absolute risk: a design change halves the failure rate
before, after = 4 / 10000, 2 / 10000                 # failures per unit per year
print(f"Relative risk reduction {(before - after) / before:.0%}; absolute reduction {(before - after) * 10000:.0f} per 10,000 units per year")
print(f"Units needing the change to prevent one failure per year: {1 / (before - after):,.0f}")Axis from 0: bar B looks 2.1% longer than A; lie factor 1.0 Axis from 90: bar B looks 33.3% longer than A; lie factor 16.0 Axis from 95: bar B looks 200.0% longer than A; lie factor 96.0 Relative risk reduction 50%; absolute reduction 2 per 10,000 units per year Units needing the change to prevent one failure per year: 5,000
Tufte's lie factor is the size of the effect shown divided by the size of the effect in the data. Comparing efficiencies of 96 % and 98 %, a bar chart starting at zero shows the true 2 % difference; one starting at 95 % makes the second bar three times as long as the first, a lie factor of 96. Such charts are common in marketing. Engineers should not make them, and should notice them in vendor literature.
Communicating numbers and risk
Audiences without technical training often struggle with probabilities, large numbers and units, and the way numbers are framed changes how they are understood. Good practice includes:
- Use natural frequencies rather than percentages or probabilities: "about 2 in 10,000 units per year" is clearer than "0.02 % annual probability".
- Give absolute as well as relative risk. The code's second result shows a design change that halves the failure rate, a 50 % relative reduction, which sounds dramatic; in absolute terms it prevents 2 failures per 10,000 units per year, and 5,000 units must be changed to prevent one failure a year. Both numbers are true; presenting only one misleads.
- Use comparisons and concrete units: "enough water for 60 households" or "the weight of two small cars" means more than "4,000 L" or "3 t" to many audiences.
- Round to a sensible precision and state uncertainty in plain terms ("between about 15 and 25 years").
- Be honest that no option is risk-free, and explain how risks will be managed, monitored and reported (ENGG-100).
Worked problem
Presenting a flood protection option to residents
A berm is designed to protect a neighborhood against a flood with a 1 % chance of occurring in any year. How should the level of protection be explained at a public meeting?
Show solution
- Avoid "the 100-year flood", which many people take to mean a flood that happens once a century and so will not recur soon.
- State the annual chance plainly: "In any year, there is about a 1 in 100 chance of a flood bigger than the berm is designed for."
- Translate to a time span residents understand: over a 30-year mortgage, the chance of at least one such flood is 1 − 0.99³⁰ ≈ 26 %, about 1 in 4.
- Explain what happens if a larger flood occurs, and what else (warning systems, emergency plans, insurance) protects them.
Answer: Explained this way, residents understand that the berm greatly reduces but does not eliminate the risk, which helps them make informed choices about insurance and preparedness. Misunderstanding "100-year" events has left communities surprised and angry when two large floods arrived within a few years.
Presenting to decision-makers
When presenting to a council, board or client for a decision, lead with the recommendation and the decision required, give the reasons and the main alternatives honestly, state costs and risks plainly, and close by restating the decision you are asking for. Respect the decision-makers' role: present the options fairly, even ones you do not favor, so they can weigh values and priorities that are theirs to weigh. If they choose an option you advised against, ensure your advice and its reasons are recorded, and, if a choice would endanger the public, follow the duties of the code of ethics (ENGG-100).
Common mistakes
MistakeBuilding slides before deciding the main message.
InsteadWrite the one-sentence message first, then plan the support.
MistakeFilling slides with paragraphs of text.
InsteadUse message headlines and visual evidence; the speaker explains.
MistakeStarting a bar chart axis above zero.
InsteadBar charts must start at zero to avoid exaggerating differences.
MistakeReporting only relative risk reductions.
InsteadGive absolute numbers too, as natural frequencies.
MistakeBluffing when you do not know an answer.
InsteadSay so, commit to finding out, and follow up.
Summary and key terms
- Plan from the audience and a one-sentence main message; lead with it.
- Structure: opening and message, context, three key points with evidence, close with the request.
- Slides: one idea each, message headlines, visual evidence, large text, backup slides for detail.
- Rehearse with a timer; answer questions directly and honestly.
- Posters need a clear finding, visual hierarchy and little text.
- Match chart type to message; maximize data-ink; design for color vision deficiency.
- Avoid misleading charts; present risk with natural frequencies and both relative and absolute numbers.
- Main message
- The single idea the audience should take away.
- Message headline
- A slide title written as a sentence stating the point.
- Backup slide
- A slide held in reserve for questions.
- Data-ink ratio
- The share of a chart's ink that conveys data.
- Lie factor
- The size of an effect shown in a chart divided by its size in the data.
- Truncated axis
- An axis that does not start at zero.
- Natural frequency
- A risk expressed as a count, such as 2 in 10,000.
- Relative risk reduction
- The fractional reduction in risk.
- Absolute risk reduction
- The difference in risk, as a rate or count.
- Annual exceedance probability
- The chance an event is exceeded in any one year.
Practice problems
Work each problem on paper first, then reveal the answer to check.
Rewrite the slide title "Test results" as a message headline.
Show answer
For example: "The prototype met all load requirements with a 20 % margin."
About how many slides suit a 12-minute talk?
Show answer
About 6 to 12, with three or so key points.
What chart would you use to show monthly energy use over three years?
Show answer
A line chart.
What chart shows whether bracket strength depends on wall thickness?
Show answer
A scatter plot of strength against thickness.
Why must a bar chart axis start at zero?
Show answer
Bar length encodes value; truncation exaggerates differences.
From the code output, what is the lie factor with the axis starting at 90?
Show answer
16.
A change cuts failures from 10 to 6 per 100,000 units. Give the relative and absolute reductions.
Show answer
40 % relative; 4 per 100,000 absolute.
Find the chance of at least one 1-in-100-year flood in 50 years.
Show answer
1 − 0.99⁵⁰ ≈ 39 %.
How should you respond to a question you cannot answer?
Show answer
Say you do not know, commit to finding out, and follow up.
Name two ways to make a chart work for people with color vision deficiency.
Show answer
For example: avoid red–green contrasts alone; use direct labels, line styles or patterns.
Lesson quiz · 5 questions
Score 60% or more to complete this lesson.
Create a free account to save your progress, take quizzes and earn a certificate.