
DCT-330 · Lesson 1 of 12 · 21 min
Watching a live facility: monitoring in the data center
A data center never sleeps, and neither does the room that watches it. At Stonebridge, every breaker, cooling unit, generator, door and leak sensor reports to software that someone is looking at, around the clock. Earlier courses taught what that equipment does: power in DCT-220, cooling in DCT-230. This course is about the layer above it: how the facility is watched, how problems are noticed and passed to the right person, and how the facility is changed without breaking it. This first lesson tours the operations desk and the systems on its screens, and sets out what a technician on monitoring duty actually does.
Jamal Pierce starts his monitoring term on a Monday night at IAD-3. For the next twelve weeks he will spend half his shifts on the operations desk beside Dmitri Volkov, the shift lead, and the other half doing the rounds, requests and changes that the desk generates. Roz Kerr, the critical facilities technician he worked with on power and cooling, is still his mentor. Anjali Desai, the site manager, has asked him to finish the term able to run the desk alone on a quiet night.
Why watch at all?
A well-designed data center is redundant: a failed CRAH, UPS module or generator leaves a spare carrying the load. That redundancy is exactly why monitoring matters. A failure that customers never notice still uses up the spare. If nobody sees it, the next failure is the one that drops the load. The operations desk exists to see every failure, warning and drift while there is still a spare, and to make sure someone fixes it before the margin is gone.
Monitoring also catches slow problems that never trip anything: a battery string losing capacity (DCT-220 lesson 5), a CDU's approach temperature creeping up as its heat exchanger fouls (DCT-230 lesson 9), a rack drawing more power each month until it passes its planning limit. And it keeps the record: the event log, trends and tickets are what the incident reports, capacity plans and audits are built from.
Industry data supports the point. Uptime Institute's outage surveys have found for years that power problems cause more than half of serious data center outages, and that human error plays a part in roughly two-thirds to four-fifths of them, often through procedures that were not followed or were wrong. Good monitoring and good change control, the two halves of this course, are the main defenses against both.
The operations desk
Stonebridge's operations desk at IAD-3 is a room off the main corridor with four workstations, a wall of large screens and a window onto the Hall A corridor. It is staffed by at least two people at all times: the shift lead and a technician. At night and on weekends they are the only operations staff on site; security has its own desk at the entrance (DCT-110 lesson 9), and engineers and critical facilities staff are on call.
The wall screens always show the same five things, so anyone glancing up sees the state of the site at once:
- The redundancy board: one tile per system (each UPS, generator block, cooling plant, CDU group, fire system), green, amber or red, as described in DCT-220 lesson 11.
- The active alarm list from the building management system, newest at the top, colored by priority.
- The electrical one-line overview from the power monitoring system, showing which breakers are closed and the load on each path.
- Hall thermal maps: inlet temperatures across each hall, from the rack sensors.
- The ticket queue: open requests and incidents, with their due times.
Each workstation has the full applications behind those screens, plus the phone, radio and the paging system used to reach on-call staff.
The systems behind the screens
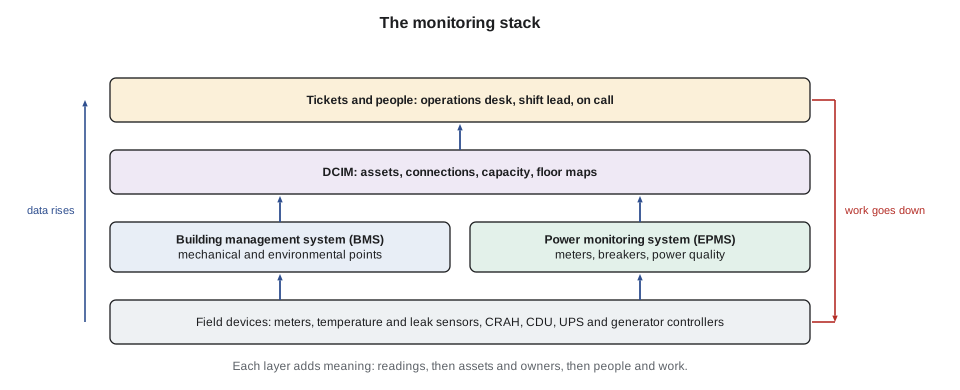
Four kinds of software run the desk. Each has a different job, and a technician needs to know which one to open for which question.
- The building management system (BMS) watches mechanical and environmental equipment: CRAHs, CDUs, chillers, dry coolers, pumps, fans, temperature and humidity sensors, leak detection and door contacts. It collects readings, raises alarms and, for some equipment, sends commands such as setpoints. Lesson 2 covers it.
- The electrical power monitoring system (EPMS) watches the power chain: utility meters, switchgear breakers, transformers, UPS systems, generators, transfer switches and branch circuit monitors. It records power quality events in fine detail. Lesson 2 covers it too.
- The data center infrastructure management system (DCIM) holds the model of the facility: every asset, where it is, what it is connected to and how much space, power and cooling it uses. It pulls live readings from the BMS and EPMS and puts them against the model. Lessons 5 and 6 cover it.
- The ticketing system records every piece of work: incidents, customer requests, changes and planned maintenance. It is how work is assigned, timed and closed. Lessons 7 to 10 cover it.
Some sites combine these in one product; others, like Stonebridge, run separate products linked together. Common commercial examples include Schneider Electric's EcoStruxure IT, Sunbird's dcTrack and Nlyte for DCIM, and many BMS and EPMS products from the major building controls and electrical equipment makers. The principles in this course apply to all of them; the screens differ.
| Question | Where to look first |
|---|---|
| Is a CRAH or CDU running and at what supply temperature? | BMS |
| What is the load on UPS-B2 right now? | EPMS |
| Which breaker feeds rack A-31-03's B side? | DCIM (connections), then the drawings |
| How much power is left in Hall A row 31? | DCIM capacity view |
| Has the customer's remote hands request been done? | Ticketing system |
| Did the voltage sag at 02:41 last night? | EPMS event log and waveform capture |
| Which door did someone use at 03:15? | Security system (security desk), not the BMS |
What the technician on the desk does
On a quiet night, the desk is mostly watching and recording. Dmitri runs the shift; Jamal's duties on the desk are:
- Acknowledge each new alarm promptly, read it, decide what it means using the alarm response procedure, and act or escalate (lesson 4).
- Answer the phone and the customer portal, open tickets for requests and reported problems, and dispatch work (lessons 7 and 8).
- Watch the trends at set times: once an hour he scrolls through the hall thermal maps, UPS loads and CDU flows looking for drift that has not yet alarmed.
- Keep the shift log: a running, time-stamped record of everything notable, in plain words.
- Hand over properly at shift change (DCT-340 covers handovers in detail).
The desk does not operate the plant. Changing a setpoint, opening a breaker or resetting a tripped unit is done by qualified staff, under a procedure, usually as part of a ticket. A technician on the desk may silence an audible alarm in the operations room and acknowledge alarms on screen; acknowledging records that a person has seen the alarm, it does not fix or hide it.
Normal, abnormal and emergency
Stonebridge describes the state of the facility in three words, used on the desk, in tickets and on the radio:
- Normal: all systems in their designed state, with full redundancy. Alarms may appear and clear, but the redundancy board is green.
- Abnormal: something has failed or is not in its normal state, but the load is still protected: a CRAH off for repair, a UPS module out, a generator in manual. The board shows amber. Abnormal states are allowed, but they must be known, ticketed and time-limited.
- Emergency: the load is threatened or lost, or people are in danger: fire, a power path lost with the other side already down, a major leak in a hall. Emergency operating procedures apply (DCT-340).
Most of the desk's skill lies in the middle state: noticing quickly when normal has become abnormal, making sure everyone who needs to know does know, and pushing to get back to normal before a second failure turns abnormal into emergency.
Worked problem
Jamal's first alarm
At 02:07 on his first night, a major-priority alarm appears: 'CRAH-A07 supply air temp high, 78.4 °F, setpoint 72 °F'. The redundancy board still shows Hall A cooling green. What does Jamal do?
Show solution
- He acknowledges the alarm, which stops the flashing and records his name and the time.
- He opens CRAH-A07 in the BMS: fan running, chilled water valve at 100 %, supply 78.4 °F and rising slowly, return 91 °F. The valve is fully open but the air is not cooling, which suggests no water flow through the coil or a valve that reports open but is not.
- He checks the hall thermal map: inlet temperatures near A07 are still 72 to 73 °F; neighboring CRAHs have increased their fan speed to compensate.
- Hall A has N+3 cooling (DCT-230 lesson 4), so the load is safe, but A07 is effectively failed. He tells Dmitri, who agrees to treat A07 as out of service.
- Jamal opens an incident ticket, records the readings, and pages the on-call mechanical technician under the cooling escalation (lesson 7). Dmitri changes A07's tile on the redundancy board to amber: N+2.
- He notes it all in the shift log.
Answer: The alarm was handled in about eight minutes without anyone touching the CRAH. The fault, a stuck valve actuator that DCT-230 described, was fixed the next morning. The record shows who saw what and when.
The temperatures in Jamal's alarm show why the units matter on the desk. Stonebridge's BMS displays °F site-wide; customers in Hall A sometimes ask in the other unit, and the desk converts without guessing.
# Converting desk readings for a customer who asks in the other unit
readings = [("CRAH-A07 supply", 78.4), ("A-17-04 inlet", 74.1), ("ASHRAE upper recommended", 80.6)]
for name, t in readings:
    other = (t - 32) * 5 / 9
print(f"{name:26s}: {t:5.1f} F = {other:5.1f} C")CRAH-A07 supply : 78.4 F = 25.8 C A-17-04 inlet : 74.1 F = 23.4 C ASHRAE upper recommended : 80.6 F = 27.0 C
The shift log
The shift log is a simple, time-stamped text record kept by the desk for every shift. It is separate from the alarm list and the tickets, because it records what people did and decided, not just what the systems reported. A good entry says who, what, when and what next, in a sentence or two, with the ticket number if there is one. Jamal's entries for his first night read, in part:
| Time | Entry |
|---|---|
| 19:00 | Shift start, Dmitri and Jamal. Board green except GEN-D2 (vendor follow-up, see CHG ticket). 14 open tickets handed over. |
| 21:30 | Remote hands for Corvid AI, node reseat D-3-07 U22, done by Jamal, photos in ticket. |
| 02:07 | CRAH-A07 supply temp high 78.4 °F, valve 100 %. Treated as out of service, board Hall A cooling amber N+2. Incident ticket raised, on-call mechanical paged 02:12, called back 02:18. |
| 04:00 | Hourly trend check: all halls normal; UPS-B2 load 31 %. |
| 06:55 | Handover to day shift; A07 and GEN-D2 open. |
Entries are factual and neutral. 'CRAH-A07 supply temp high' is better than 'A07 broke again'; 'customer reported' is better than 'customer complained'. The log is read by managers, auditors and sometimes customers, and it is often the main source when an incident report is written.
Who else is watching
Stonebridge is not the only party watching the hall. Customers watch their own equipment: Corvid AI's operations team watches every GPU node in Hall D, and the cloud tenant in Halls B and C runs its own monitoring of servers and network. Some customers also receive a feed of the facility readings for their space, such as inlet temperatures and branch circuit loads, through a customer portal. Equipment makers watch some plant remotely: the UPS and generator vendors receive alarms from their units under service contracts. The fire alarm system is monitored by a listed monitoring station, as covered in the fire alarm courses.
This matters because problems are often seen first by someone else. When Corvid's team calls to say that eight GPU nodes in one rack have all reported high inlet temperature, the desk may not yet have an alarm, because the facility's sensor for that rack is at a different height. The desk treats every outside report as real until it is checked, opens a ticket and looks.
Security on the desk
Monitoring systems are themselves part of the critical infrastructure. If an outsider could reach the BMS, they could change setpoints or switch off cooling. Stonebridge keeps the BMS, EPMS and controllers on separate, isolated networks, with access through named accounts only, and records every login and command. The desk staff follow simple rules: never share a login, lock the workstation when stepping away, never plug a personal device or an unknown USB stick into a desk machine, and report any setpoint or mode change that nobody on the shift made. These rules are part of the site's security policy; the deeper design of these networks belongs to the engineers.
Common mistakes
MistakeAcknowledging an alarm and moving on.
InsteadAcknowledge, then read, assess and act or escalate; acknowledging only records that you have seen it.
MistakeTreating the redundancy board as decoration because everything is redundant.
InsteadEvery failure uses up a spare; the board is how the next failure is prevented from dropping the load.
MistakeChanging a setpoint on a struggling CRAH from the desk.
InsteadReport and ticket it; setpoint and mode changes are made by qualified staff under a procedure.
MistakeWriting 'A07 broke again' in the shift log.
InsteadWrite factual, time-stamped entries with readings, actions and ticket numbers.
MistakeDismissing a customer's report because the facility shows no alarm.
InsteadOpen a ticket and check; customers often see problems first.
Summary and key terms
- The operations desk watches the facility around the clock so that failures are fixed while redundancy remains.
- The BMS watches mechanical and environmental equipment; the EPMS watches the power chain; DCIM holds the model of assets and capacity; tickets record the work.
- The technician on the desk acknowledges and assesses alarms, takes requests, watches trends, keeps the shift log and hands over; the desk does not operate the plant.
- Normal, abnormal and emergency describe the facility's state; abnormal states must be known, ticketed and time-limited.
- Customers, vendors and monitoring stations also watch parts of the facility, and their reports are treated as real until checked.
- Monitoring systems are protected with named accounts, isolated networks and simple desk security rules.
- BMS
- Building management system: software that monitors and controls mechanical and environmental equipment.
- EPMS
- Electrical power monitoring system: software that monitors meters, breakers and power equipment.
- DCIM
- Data center infrastructure management: software that models the facility's assets, connections and capacity.
- Acknowledge
- To record that a person has seen an alarm; it does not clear or fix it.
- Shift log
- A time-stamped record of what the shift saw, did and decided.
- Abnormal state
- A condition where something has failed or is off normal but the load is still protected.
Practice problems
Work each problem on paper first, then reveal the answer to check.
Why does a fully redundant facility still need someone watching it?
Show answer
Each failure uses up a spare; unseen failures leave the load exposed to the next one.
Which system would you open to see whether a breaker on SWBD-A2 is closed?
Show answer
The EPMS.
What does acknowledging an alarm do?
Show answer
It records that someone has seen it; it does not clear or fix the fault.
Give two things a good shift log entry contains.
Show answer
The time, what was seen or done, readings, actions taken, who was told and the ticket number.
Lesson quiz · 5 questions
Score 60% or more to complete this lesson.
Create a free account to save your progress, take quizzes and earn a certificate.