
DCE-460 · Lesson 5 of 12 · 24 min
IT efficiency: utilization, hardware and software
Infrastructure efficiency, measured by PUE, has improved so much in modern facilities that the overhead is often only 10 to 20 % of IT energy. The IT equipment itself now offers the largest remaining opportunities: servers that sit idle for most of the day, servers that do no useful work at all, old hardware that delivers a fraction of the performance per watt of new equipment, and software that wastes computation. Every watt saved at the IT equipment is also multiplied by the PUE, because it removes the associated power conversion and cooling. This lesson covers server power and utilization, comatose servers, consolidation and virtualization, hardware refresh and performance per watt, accelerators for AI, storage and networking, and software and operational practices that reduce IT energy.
Server power and utilization
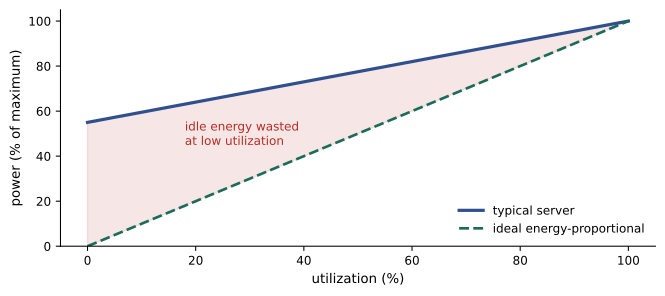
A server's power consumption rises with its workload, but not from zero. An idle server typically draws 30 to 60 % of its maximum power, because processors, memory, fans, power supplies and other components consume energy even when doing nothing useful. Energy proportionality, the ideal of power rising in proportion to work, has improved with modern processors, but most servers remain far from proportional. A simple linear model captures the effect:
where u is utilization from 0 to 1. Because of the large idle power, a server running at 10 % utilization consumes most of the power of one at 50 % while doing a fifth of the work. Many enterprise servers historically averaged 10 to 20 % utilization, wasting much of their energy. Hyperscale cloud operators achieve much higher average utilization by pooling workloads across many customers.
Comatose servers
Surveys of enterprise data centers have repeatedly found that a significant fraction of servers, often estimated at 10 to 30 %, are comatose (sometimes called zombie servers): powered on, consuming energy, but doing no useful work, because the application they ran was retired, the project ended or nobody remembers what they do. Finding them requires inventory data from DCIM and IT asset management systems, utilization monitoring over weeks, and an organizational process to confirm with owners that a server can be switched off. The savings are immediate and cost nothing in hardware.
Consolidation and virtualization
Virtualization runs many workloads as virtual machines or containers on a single physical server, allowing the work of many lightly loaded servers to be consolidated onto a few busier ones. Combined with removing comatose servers and refreshing old hardware, consolidation can reduce IT energy dramatically.
# Server consolidation and refresh: energy at the wall, including facility overhead
def server_power(util, p_idle, p_max):
    return p_idle + (p_max - p_idle) * util          # simple linear power model, watts

pue, hours = 1.5, 8760
old = dict(n=1000, util=0.10, p_idle=220, p_max=400, perf=1.0)   # perf = work per server at 100 %
work = 0.9 * old["n"] * old["util"] * old["perf"]   # useful work: 10 % of servers are comatose

e_old = old["n"] * server_power(old["util"], old["p_idle"], old["p_max"]) * hours * pue / 1e6
n0, u0 = old["n"], old["util"]
print(f"Today: {n0} servers at {u0:.0%} -> {e_old:,.0f} MWh/yr")

# Step 1: remove comatose servers (10 % doing no useful work)
n1 = int(old["n"] * 0.9)
u1 = work / (n1 * old["perf"])
e1 = n1 * server_power(u1, old["p_idle"], old["p_max"]) * hours * pue / 1e6
print(f"Remove comatose 10 %: {n1} servers at {u1:.0%} -> {e1:,.0f} MWh/yr")

# Step 2: virtualize onto old hardware at 50 % utilization
n2 = round(work / (0.5 * old["perf"]))
e2 = n2 * server_power(0.5, old["p_idle"], old["p_max"]) * hours * pue / 1e6
print(f"Consolidate to 50 %: {n2} servers -> {e2:,.0f} MWh/yr")

# Step 3: refresh to new servers with 4x the performance and better idle power
new = dict(p_idle=180, p_max=550, perf=4.0)
n3 = max(1, round(work / (0.5 * new["perf"])))
e3 = n3 * server_power(0.5, new["p_idle"], new["p_max"]) * hours * pue / 1e6
print(f"Refresh, 4x performance: {n3} servers -> {e3:,.0f} MWh/yr ({1 - e3 / e_old:.0%} below today)")Today: 1000 servers at 10% -> 3,127 MWh/yr Remove comatose 10 %: 900 servers at 10% -> 2,815 MWh/yr Consolidate to 50 %: 180 servers -> 733 MWh/yr Refresh, 4x performance: 45 servers -> 216 MWh/yr (93% below today)
In this illustrative case, the original estate of 1,000 servers at 10 % utilization uses about 3,100 MWh a year including facility overhead. Removing the 10 % that are comatose saves about 10 %. Consolidating the remaining work onto servers running at 50 % cuts energy by about three-quarters, because idle power is no longer multiplied across hundreds of lightly used machines. Refreshing to newer servers with four times the performance per server brings the total to about 7 % of the original. Real projects rarely achieve the full theoretical savings, because of peaks, redundancy and application constraints, but reductions of 50 % or more are common.
Consolidation must respect reliability and performance: workloads need headroom for peaks, redundancy across physical hosts and failure domains, and enough memory and network capacity. Utilization targets of 50 to 70 % for general-purpose virtualized clusters are common.
Hardware refresh and performance per watt
Each new generation of processors typically delivers substantially more computation per watt than the last, so old servers can be poor value to keep running even if they still work. Server efficiency benchmarks such as SPECpower_ssj2008 and the SERT suite used by ENERGY STAR and the EU's ecodesign rules measure performance per watt across load levels. When deciding whether to replace servers, the energy saved must be weighed against the embodied carbon and cost of new hardware (Lesson 10): replacing a server that is a few years old with a far more efficient one often pays back in energy and carbon within a few years, while replacing a recent server may not. Life-extension practices, such as reusing servers for less demanding workloads, can also be part of a circular strategy.
Accelerators and AI workloads
AI training and inference run mainly on accelerators such as GPUs and custom chips, which deliver far more operations per joule than general-purpose processors for these tasks but draw hundreds to over a thousand watts each, with racks reaching 100 kW or more. Energy efficiency for AI involves several layers:
- Hardware choice: newer accelerators and lower-precision arithmetic (such as 8-bit and 4-bit formats) deliver much more work per joule.
- Utilization: expensive accelerators idle between jobs waste both capital and energy; schedulers and shared clusters raise utilization (AI-420, Lesson 9).
- Model and software efficiency: smaller, distilled or quantized models, efficient serving with batching and caching, and avoiding unnecessary retraining reduce energy per useful result.
- Measurement: reporting energy per training run or per thousand inferences helps teams compare options and make energy part of design decisions.
Because AI demand is growing so quickly, efficiency gains per operation do not necessarily reduce total energy (Lesson 1). They do, however, determine how much useful work a given amount of energy and grid capacity can deliver.
Storage and networking
Storage and networking typically account for a smaller share of IT energy than servers, but they are not negligible. Storage energy depends on the media (hard disks consume more power per device than solid-state drives, but far less per terabyte for cold data), on replication and backup policies, and on how much data is kept. Data management practices, such as deleting obsolete data, tiering cold data to low-power media or tape, deduplication and compression, reduce storage energy and hardware. Network equipment draws relatively constant power regardless of traffic, so right-sizing and consolidating network gear, and using efficient optics, help.
Software and operations
Software determines how much hardware a service needs. Inefficient code, chatty microservices, unnecessary polling and oversized virtual machines all consume energy. Green software practices include measuring the energy or carbon of applications (for example with the Software Carbon Intensity specification from the Green Software Foundation), right-sizing cloud resources, autoscaling to follow demand, shutting down development and test environments outside working hours, and scheduling flexible batch work for times and places where electricity is cleaner (carbon-aware computing, Lesson 8). Organizational practices matter as much as technical ones: chargeback or showback of energy costs to application owners, procurement standards for efficient hardware, and regular reviews of utilization.
Worked problem
Shutting down idle environments
A company runs 200 development and test virtual machines continuously, each averaging 60 W of host power including its share of idle overhead. They are used only during working hours, 10 hours a day on weekdays. If they are shut down automatically at other times, how much energy is saved per year at a PUE of 1.5?
Show solution
- Hours used per year: 10 × 5 × 52 = 2,600 hours, out of 8,760.
- Hours saved: 8,760 − 2,600 = 6,160 hours.
- Energy saved: 200 × 60 W × 6,160 h × 1.5 ≈ 110,900 kWh, about 111 MWh a year.
Answer: About 111 MWh a year, with no hardware cost, provided the hosts are consolidated or powered down as the virtual machines stop; shutting down VMs on hosts that remain powered on saves much less, because of host idle power. This illustrates why operational practices and infrastructure automation must work together.
Measuring IT efficiency in practice
Improving IT efficiency starts with visibility. DCIM and IT asset management systems should hold an accurate inventory of every server with its owner, function and age; monitoring should record each server's power and utilization over weeks rather than moments; and reports should highlight servers with persistently low utilization, very old hardware and equipment without an identified owner. Showing application owners the energy, cost and carbon attributable to their systems often prompts consolidation that technical teams alone cannot achieve. For colocation providers, whose customers own the IT equipment, the levers are indirect: offering efficiency assessments, providing power and utilization data, pricing that rewards efficiency, and sharing practices that customers can adopt.
IT efficiency and infrastructure efficiency also interact. As consolidation reduces IT load, a facility's PUE may rise because fixed overheads are spread over less IT energy, even though total energy falls. Reporting total energy and emissions alongside PUE prevents this from being misread as a deterioration, and it reminds teams that the goal is less energy for the same useful work, not a better ratio.
Common mistakes
MistakeFocusing only on PUE.
InsteadAddress IT utilization, comatose servers and hardware efficiency as well.
MistakeAssuming idle servers use little power.
InsteadAccount for idle power, typically 30 to 60 % of maximum.
MistakeKeeping very old servers because they still work.
InsteadCompare performance per watt and embodied carbon to decide on refresh.
MistakeLeaving test environments running around the clock.
InsteadAutomate shutdown and consolidate hosts when idle.
MistakeMeasuring AI efficiency only per operation.
InsteadTrack energy per useful result and total energy as demand grows.
Summary and key terms
- IT equipment offers the largest remaining efficiency opportunities, multiplied by PUE.
- Idle servers draw 30 to 60 % of maximum power; low utilization wastes energy.
- Comatose servers, often 10 to 30 % in enterprises, can be switched off at no cost.
- Virtualization and consolidation can cut IT energy by more than half.
- Refresh decisions weigh performance per watt against embodied carbon.
- AI efficiency depends on hardware, utilization, model efficiency and measurement.
- Storage, networking, software and operations practices also reduce energy.
- Utilization
- The fraction of a server's capacity in use.
- Energy proportionality
- Power consumption proportional to work done.
- Idle power
- The power a server draws when doing no work.
- Comatose server
- A powered server doing no useful work.
- Virtualization
- Running multiple virtual machines on one physical server.
- Consolidation
- Moving workloads onto fewer, busier servers.
- Performance per watt
- Useful work delivered per unit of power.
- SPECpower
- A benchmark of server performance per watt across loads.
- Carbon-aware computing
- Shifting flexible work to cleaner times or places.
- Showback
- Reporting resource costs to the teams that use them.
Practice problems
Work each problem on paper first, then reveal the answer to check.
A server idles at 200 W and peaks at 400 W. What does it draw at 25 % utilization?
Show answer
200 + 200 × 0.25 = 250 W.
Why does low utilization waste energy?
Show answer
Idle power is a large share of maximum, so little work is done per watt.
What is a comatose server?
Show answer
A server that is powered on but does no useful work.
From the output, how much do comatose removal and consolidation save together?
Show answer
From about 3,127 to 733 MWh a year, about 77 %.
Why do consolidated clusters target 50 to 70 % rather than 100 %?
Show answer
To leave headroom for peaks and redundancy.
What two factors decide whether to refresh servers?
Show answer
Energy and performance gains versus embodied carbon and cost of new hardware.
Name two ways to improve AI energy efficiency.
Show answer
Newer accelerators, lower precision, higher utilization, smaller or quantized models, batching.
Why are hard disks still used for cold data?
Show answer
They use less power per terabyte than SSDs for rarely accessed data.
What is carbon-aware computing?
Show answer
Scheduling flexible work when and where electricity is cleaner.
Recalculate the example for 100 VMs at 80 W.
Show answer
100 × 80 × 6,160 × 1.5 ≈ 73.9 MWh a year.
Lesson quiz · 5 questions
Score 60% or more to complete this lesson.
Create a free account to save your progress, take quizzes and earn a certificate.