
CSCO-111 · Lesson 11 of 12 · 25 min
Network topologies and diagrams
▶ Video coming soon A video version of this lesson is on the way.
When Prairie Paws opened its second location two years ago, the previous IT company left behind a single diagram: a photo of a whiteboard, slightly blurred, showing two clouds, a few boxes and an arrow labeled 'VPN?'. Brightline has worked from that photo ever since. After the October outage that opened this course, Owen Larkin decides that every client will get a proper set of diagrams, and he asks Dev and Jordan to start with Prairie Paws. Dev explains that drawing a network well means understanding its topology, the shape of its connections, and choosing what each diagram should show. A diagram that tries to show everything shows nothing clearly.
This lesson covers the types of network by size and purpose, physical and logical topologies, the common topology shapes and network designs, the performance terms used to describe links, and how to read and draw network diagrams. These topics belong to the standards and concepts domain of the exam and to the daily work of every technician.
Types of network by size and purpose
Networks are often described by the area they cover. A personal area network, PAN, connects devices around one person, such as a phone, headset and watch over Bluetooth. A local area network, LAN, connects devices in one building or site, usually with Ethernet and Wi-Fi, and is owned by the organization that uses it. A wireless LAN, WLAN, is a LAN that uses Wi-Fi. A campus area network, CAN, joins several buildings on one property, such as a college or hospital campus, usually with fiber. A metropolitan area network, MAN, spans a city, often run by a provider or a municipality. A wide area network, WAN, connects sites across large distances using links leased from providers or tunnels across the internet; the internet itself is the largest WAN.
One more type is defined by purpose rather than size. A storage area network, SAN, is a dedicated high-speed network that connects servers to shared storage, using technologies such as Fiber Channel or iSCSI. It is found in data centers and larger organizations, and it is distinct from network-attached storage, which shares files over the ordinary LAN.
| Type | Area | Typical technology | Example |
|---|---|---|---|
| PAN | Around one person | Bluetooth, USB | Phone and wireless earbuds |
| LAN / WLAN | One building or site | Ethernet, Wi-Fi | A Kettle & Crumb shop |
| CAN | Several buildings on one site | Fiber between buildings | A college campus |
| MAN | A city | Provider fiber or wireless | A city's network linking libraries |
| WAN | Regions, countries, the world | Provider links, VPNs over the internet | Prairie Paws' two locations joined |
| SAN | A data center or server room | Fiber Channel, iSCSI | Servers sharing a storage array |
Physical and logical topology
The physical topology of a network is how the cables and devices are actually laid out: which device plugs into which, through which rooms and walls. The logical topology is how data flows, and how the network is organized at layers 2 and 3: which devices are in which VLAN and subnet, and which routers and firewalls traffic passes through. The two can be very different. An office might be physically one switch with every device plugged into it, but logically three separate networks for staff, guests and cameras. Technicians need both views, and good documentation provides both.
Topology shapes
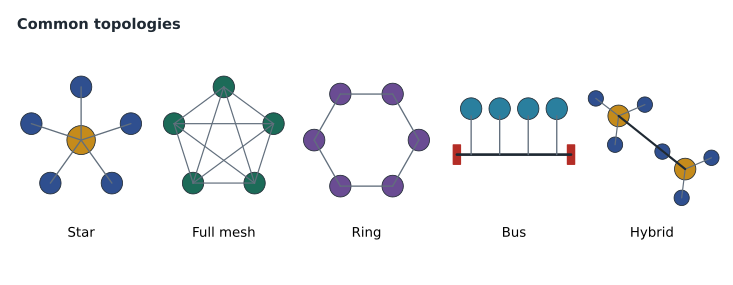
A star topology connects every device to a central point, usually a switch. It is the standard shape of modern Ethernet LANs. A failed cable affects only one device, and adding or moving devices is easy, but the central switch is a single point of failure. An extended star, or tree, connects several stars together, such as a main switch in a network room linked to smaller switches on each floor; this is the shape of most building networks.
A mesh topology connects devices to several others, so that there are multiple paths. In a full mesh, every device connects directly to every other device. The number of links grows quickly: n devices need n times (n − 1) divided by 2 links, so five routers in a full mesh need 10 links and ten routers need 45. Full mesh gives the most redundancy but is expensive, so many networks use a partial mesh, where only the most important devices have multiple links. Wireless mesh systems, as lesson 8 described, are a form of mesh where the links are radio.
A ring topology connects each device to two neighbors, forming a loop. Data travels around the ring, and if one link breaks, traffic can go the other way in a dual ring. Rings are found in some provider fiber networks and industrial networks. A bus topology connects every device to a single shared cable, as early coaxial Ethernet did; one break takes down the whole segment, and it is now historic. A hybrid topology combines several shapes, such as stars at each site joined by a partial mesh of WAN links, and describes most real networks.
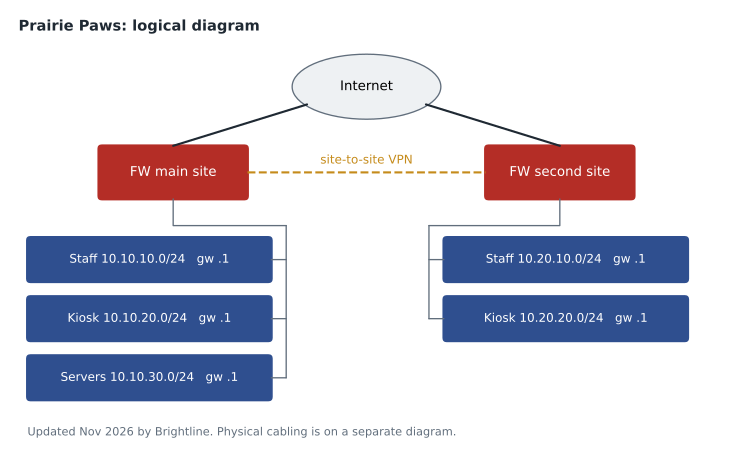
WANs have their own common shapes. A point-to-point link connects exactly two sites. A hub-and-spoke design connects branch sites to a central site, so that traffic between two branches passes through the hub; it is simple and cheap but makes the hub critical. Prairie Paws is a two-site point-to-point design, with a VPN tunnel over the internet joining the main and second locations. Software-defined WAN, SD-WAN, is a modern approach in which a central controller manages tunnels over several internet links and chooses the best path for each application, and many small organizations now use it instead of leased private links.
Hierarchical network designs
Larger networks are organized in layers of their own. In the classic three-tier design, the access layer is where end devices connect, through switches in each wiring closet; the distribution layer aggregates the access switches, applies policies and routes between VLANs; and the core layer is a fast backbone joining the distribution switches. Smaller networks often use a two-tier, or collapsed core, design, where a pair of switches does both the distribution and core jobs. Data centers often use a spine-and-leaf design, in which every leaf switch, connecting servers, links to every spine switch, so that any server is the same number of hops from any other.
These designs are mostly beyond small businesses, but technicians meet them as soon as they work for a school board, a hospital or a large company, and the terms appear on the exam. The access layer is where most help-desk and field work happens: patching ports, replacing switches, and finding which port a device is on.
Bandwidth, throughput, latency and jitter
Four performance terms describe how well a link or path works. Bandwidth is the capacity of a link, the maximum rate it can carry, measured in bits per second, such as 1 gigabit per second. Throughput is the rate actually achieved, which is always lower because of protocol overhead, sharing and errors. Latency is the time a packet takes to travel from source to destination, usually measured as round-trip time in milliseconds by ping; it depends on distance, the number of devices along the path and any queueing. Jitter is the variation in latency from packet to packet; a link with an average latency of 30 milliseconds that swings between 10 and 90 has high jitter. Packet loss is the share of packets that never arrive.
Different applications care about different measures. File transfers and backups care most about throughput. Web browsing is affected by latency because each page needs many round trips. Voice and video calls are sensitive to latency, jitter and loss: common guidance is to keep one-way latency under about 150 milliseconds, jitter under about 30 milliseconds and loss under about 1 in 100 packets. Quality of service, QoS, settings, covered in CSCO-112, give real-time traffic priority so that it meets these targets even when the link is busy.
# How long does a 2 GB backup take over different links?
size_bits = 2 * 8 * 10**9          # 2 gigabytes in bits (decimal units)
for name, mbps, efficiency in [('Cable internet upload', 50, 0.85),
                               ('Fibre internet upload', 500, 0.9),
                               ('Gigabit LAN', 1000, 0.94)]:
    seconds = size_bits / (mbps * 10**6 * efficiency)
print(f'{name:22} {mbps:>5} Mb/s -> about {seconds / 60:5.1f} minutes')Cable internet upload 50 Mb/s -> about 6.3 minutes Fiber internet upload 500 Mb/s -> about 0.6 minutes Gigabit LAN 1000 Mb/s -> about 0.3 minutes
Why diagrams matter
A network diagram is a map that lets a technician who has never visited a site understand it in minutes. Good diagrams speed up troubleshooting, make changes safer and are essential for planning. They also protect a business when staff leave: the knowledge in a technician's head goes with them, but a diagram stays. Dev's rule is that a change is not finished until the diagram matches it.
Two kinds of diagram are standard. A physical diagram shows the actual devices and cables: which switch port connects to which patch panel position, which rooms the cables run through, what is in each rack, and where the provider's equipment is. Rack elevation drawings, which show each device's position in a rack, and floor plans with outlet and access point locations are kinds of physical diagram. A logical diagram shows the layer 2 and layer 3 structure: VLANs, subnets and their addresses, routers and firewalls, the gateways for each network, and the links between sites. It usually ignores cable routes and switch port numbers.
What goes on a diagram
Diagrams use standard symbols so that anyone can read them. A router is often a circle with four arrows, a switch a flat box with arrows, a firewall a brick wall, an access point a small box with radio waves, a cloud the internet or a provider network, and lines the links, with labels for their speed or type. Vendors publish icon sets, and Cisco's icons are widely used; what matters most is that every diagram includes a legend and uses symbols consistently.
Labels make a diagram useful. Every device should have its name, and names should follow a convention so that a technician can tell what and where a device is: Brightline uses the client code, site, device type and number, such as PP-MAIN-SW01 for Prairie Paws' first switch at the main site. Links should show interface names at each end and their speed. Logical diagrams should show each subnet with its prefix and gateway and each VLAN with its number and name. Every diagram should show the date it was last updated and who updated it.
Diagrams work with other records. An IP address management spreadsheet or tool lists every subnet and every static or reserved address. A port map lists which device is on which switch port. A configuration backup holds each device's settings. The diagram ties them together. All of them should be stored where the whole team can find them, with access controlled, because a network diagram is also exactly what an attacker would want.
Worked problem
Counting mesh links
Kettle & Crumb is considering connecting its office and three shops so that every site has a direct VPN tunnel to every other site. How many tunnels would that need, and how many for a hub-and-spoke design with the office as the hub?
Show solution
- There are four sites: the office and three shops, so n = 4.
- A full mesh needs n × (n − 1) ÷ 2 = 4 × 3 ÷ 2 = 6 tunnels.
- A hub-and-spoke design connects each shop to the office only: 3 tunnels.
- Hub-and-spoke is simpler, but shop-to-shop traffic would pass through the office.
Answer: A full mesh needs 6 tunnels; hub-and-spoke needs 3.
Worked problem
Choosing the right diagram
A technician who has never been to Northfield must find out which switch port the lab's cabinet uplink connects to, and another must check which subnet the guest Wi-Fi uses. Which diagram does each need?
Show solution
- The switch port of a specific cable is a physical detail.
- The first technician needs the physical diagram or the port map for the network room.
- The guest subnet is a layer 3 detail.
- The second technician needs the logical diagram or the address plan.
Answer: The first needs the physical diagram or port map; the second needs the logical diagram or address plan.
After two weeks, Prairie Paws has a physical diagram for each location, a logical diagram for the whole clinic, a port map for each switch, and an address plan. The blurred whiteboard photo is archived, with a note that it is out of date. Dev says the next lesson will test whether Jordan can use all of this on real problems.
Common mistakes
MistakeAssuming the physical and logical topology are the same.
InsteadOne switch can carry several VLANs and subnets; document both views.
MistakeUsing n × (n − 1) for full-mesh links.
InsteadDivide by 2, because each link joins two devices.
MistakeTreating bandwidth and throughput as the same thing.
InsteadBandwidth is capacity; throughput is what is actually achieved.
MistakePutting every detail on one diagram.
InsteadUse separate physical and logical diagrams, each with its own purpose.
MistakeLeaving diagrams undated.
InsteadShow when each diagram was last updated and by whom.
Summary and key terms
- Networks are described by area: PAN, LAN and WLAN, CAN, MAN and WAN; a SAN connects servers to storage.
- Physical topology is the cable layout; logical topology is how data flows and how VLANs and subnets are arranged.
- Star and extended star are standard for LANs; mesh gives redundancy and needs n(n − 1)/2 links for a full mesh.
- Ring, bus and hybrid topologies, and point-to-point, hub-and-spoke and SD-WAN designs, appear in WANs and older networks.
- Hierarchical designs use access, distribution and core layers, or a collapsed core; data centers use spine and leaf.
- Bandwidth is capacity, throughput is achieved rate, latency is delay, and jitter is variation in delay.
- Physical and logical diagrams, with consistent symbols, names, labels and dates, are essential documentation.
- LAN
- Local area network, covering one building or site.
- WAN
- Wide area network, connecting distant sites.
- Physical topology
- The actual layout of cables and devices.
- Logical topology
- The arrangement of data flow, VLANs and subnets.
- Full mesh
- A topology in which every device connects directly to every other.
- Hub and spoke
- A WAN design in which branch sites connect only to a central site.
- Access layer
- The part of a hierarchical network where end devices connect.
- Latency
- The time for a packet to cross the network, often measured as round-trip time.
- Jitter
- Variation in latency between packets.
Practice problems
Work each problem on paper first, then reveal the answer to check.
What kind of network connects a college's buildings?
Show answer
A campus area network, CAN.
How many links are in a full mesh of six devices?
Show answer
15.
What is the main weakness of a star topology?
Show answer
The central device is a single point of failure.
Which hierarchical layer do end devices connect to?
Show answer
The access layer.
What is jitter?
Show answer
Variation in latency from packet to packet.
Which diagram shows subnets and gateways?
Show answer
The logical diagram.
Name three things every diagram should include.
Show answer
Device names, link labels and the date last updated, among others.
Lesson quiz · 5 questions
Score 60% or more to complete this lesson.
Create a free account to save your progress, take quizzes and earn a certificate.