
CRE-340 · Lesson 10 of 12 · 28 min
Measurement, reporting and ROI
Measurement closes the campaign loop. A good report tells stakeholders whether the campaign met its objectives, what it cost per result, what it was worth, which creators and content worked best and what to change next time. A poor report buries a few impressive numbers in pages of screenshots and leaves everyone unsure whether to spend again. This lesson covers collecting reliable data, the main cost and return metrics, the problems with earned media value, valuing content, scoring creators after a campaign and presenting results honestly.
Collecting reliable data
Creator campaign data comes from several sources: the creators' own platform analytics, platform tools that report on branded content or paid partnerships, the brand's ad accounts for amplified posts, web analytics and affiliate tools for clicks and sales, and survey or lift studies. Each source has gaps. Public metrics such as likes and comments can be seen by anyone, but reach, impressions, watch time, saves and audience demographics are private to the account and must be shared by the creator.
The most reliable route is first-party data shared directly from the platform, through official integrations with influencer software or through platform branded-content tools that give brands access to post insights. Screenshots are common but can be cropped, taken at different times or, rarely, altered. If you rely on screenshots, specify in the contract which metrics are required, at what point after posting (for example 7 and 30 days) and in what format, and spot-check them against public figures.
Time windows matter. Views on short-form video often accumulate mostly in the first few days, while long-form video and blog content can keep growing for months through search. Report results at fixed intervals, such as 7 days and 30 days after posting, so creators and campaigns can be compared fairly.
Cost metrics and return metrics
Lesson 2 introduced CPM, CPE and CPA. Reports should calculate these using the full cost of each creator, including fees, usage, product, shipping and amplification attributed to that creator, not just the headline fee. Return metrics then compare what the campaign produced with what it cost.
ROAS and ROI are often confused. Return on ad spend uses revenue, so a ROAS of 3 means $3 of revenue for each $1 spent. Return on investment uses profit after the cost of goods and the campaign itself, so it can be negative even when ROAS looks healthy. A brand with a 30 % gross margin needs a ROAS above about 3.3 just to break even on first purchases.
Worked problem
ROAS versus ROI
A campaign cost $50,000 including fees, usage, product and amplification. Attributed revenue was $140,000, and the gross margin is 35 %. Calculate ROAS, gross profit, ROI and the break-even ROAS.
Show solution
- ROAS: 140,000 ÷ 50,000 = 2.8.
- Gross profit: 140,000 × 0.35 = $49,000.
- ROI: (49,000 − 50,000) ÷ 50,000 = −0.02, or −2 %.
- Break-even ROAS: 1 ÷ 0.35 ≈ 2.86.
Answer: ROAS of 2.8 sounds good, but ROI is −2 %: the campaign slightly lost money on first purchases unless repeat purchases or other value are counted.
Customer lifetime value
For businesses with repeat customers, judging a campaign only on first purchases understates its value. Customer lifetime value (LTV) estimates the gross profit a typical customer generates over their relationship with the brand. If creator-acquired customers behave like other customers, multiplying new customers by LTV gives a fuller picture. Check whether they do: some creator campaigns attract bargain hunters who never return, while others attract loyal fans.
Worked problem
ROI using lifetime value
The campaign above acquired 1,400 new customers. The brand estimates average lifetime gross profit per customer at $70, including the first purchase. What is the lifetime ROI?
Show solution
- Lifetime gross profit: 1,400 × $70 = $98,000.
- Lifetime ROI: (98,000 − 50,000) ÷ 50,000 = 0.96, or 96 %.
Answer: About 96 % lifetime ROI, assuming creator-acquired customers repeat as often as the average customer; track a cohort to confirm.
The trouble with earned media value
Earned media value (EMV) is a widely used metric that assigns a dollar value to creator content by multiplying engagements or impressions by an assumed price per engagement or per impression. A report might say a campaign that cost $20,000 generated $180,000 in EMV. The figure is attractive because it always looks large and is easy to calculate, but it has serious weaknesses.
- There is no standard method. Different vendors use different rates for likes, comments, shares and views, so the same campaign can show very different EMV.
- It measures what the attention would have cost to buy, not what it was worth to the business. Attention that does not change awareness or behavior has no value.
- It often counts low-value actions, such as likes, at prices taken from premium ad formats.
- It ignores whether the audience was in the target market.
- It invites comparison with spend as if it were revenue, which it is not.
EMV can still be a rough way to compare the efficiency of creators within one program if the method is consistent, but it should never be the headline result or presented as a return. When stakeholders ask for EMV, offer alternatives that connect to objectives: cost per thousand people reached in the target audience, cost per engaged view, awareness lift, incremental sales or ROI.
Valuing content
When creators produce content the brand reuses in ads, on its website or in email, that content has value beyond the original post. One way to estimate it is the cost the brand would otherwise pay for equivalent content from a studio or agency. Another is its performance as advertising: if creator content lowers the brand's CPA in paid campaigns, the saving is real value.
Worked problem
Value of reusable content
A campaign delivered 30 short videos licensed for 12 months of paid use. The brand's agency charges about $1,800 per comparable short video. The brand used 12 of the videos in ads during the year. Estimate a conservative production value.
Show solution
- Only count assets actually used: 12 videos.
- Equivalent agency cost: 12 × $1,800 = $21,600.
- Report this separately from sales returns and do not add it to revenue.
Answer: A conservative content value of about $21,600 for the 12 videos used, reported as cost avoided rather than revenue.
Scoring creators after the campaign
Post-campaign creator scorecards guide decisions about whom to rehire, renegotiate with or drop. Compare creators on the campaign's primary KPI and cost per result, adjusted where relevant for audience size and tier, and on softer factors: content quality, professionalism, compliance and comment sentiment. Look at median performance across several posts rather than single results.
| Creator | Total cost | Reach | Purchases | Cost per 1,000 reached | CPA | Decision |
|---|---|---|---|---|---|---|
| Creator 1 | $6,000 | 240,000 | 150 | $25.00 | $40.00 | Rehire; strong on both |
| Creator 2 | $2,500 | 60,000 | 125 | $41.67 | $20.00 | Scale to ambassador |
| Creator 3 | $9,000 | 400,000 | 90 | $22.50 | $100.00 | Use for awareness only |
| Creator 4 | $1,500 | 20,000 | 10 | $75.00 | $150.00 | Do not rehire |
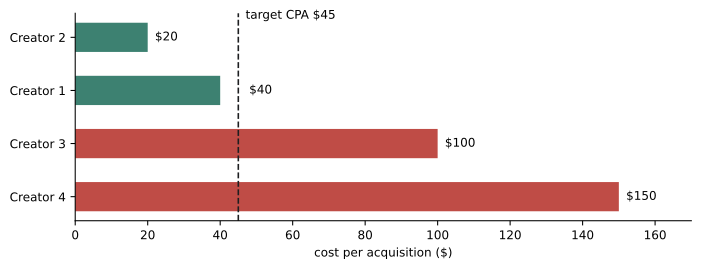
The table shows why a single metric can mislead. Creator 3 had the cheapest reach but the worst CPA except for Creator 4, so it suits awareness campaigns, not sales. Creator 2 was mediocre on reach cost but excellent on CPA. Matching creators to future objectives is more useful than ranking them on one number.
Structuring the report
A clear campaign report usually follows this order:
- Executive summary: objectives, headline results against targets, total spend and the main recommendation, on one page.
- Results against KPIs: primary, secondary and diagnostic metrics, with definitions and sources.
- Cost efficiency: CPM, CPE, CPA and ROAS or ROI, using full costs.
- Incrementality and lift: results of any holdout, lift or regional tests, with confidence notes.
- Creator and content insights: top performers, formats and hooks that worked, and those that did not.
- Compliance and risk: disclosure rate, issues found and how they were fixed.
- Learnings and recommendations: what to keep, change and test next.
Use charts sparingly and label them clearly. Show targets alongside results. State limitations honestly, such as missing data from a creator or a tracking outage. Stakeholders trust reports that admit uncertainty more than those that claim everything worked.
Presenting results honestly
There is pressure to present every campaign as a success, especially when budgets are reviewed. Resist it. Cherry-picking the best metric, switching to vanity metrics when the primary KPI was missed or presenting EMV as return all erode trust and lead to bad decisions next time. A campaign that missed its objective but taught the team which creators and formats work is valuable if reported honestly. Organizations that learn from failures improve faster than those that hide them.
Share results with creators too. Telling creators how their content performed, and what worked across the campaign, helps them improve, builds goodwill and makes them more likely to work with the brand again. Respect confidentiality: share each creator's own results and campaign-wide insights, not other creators' fees.
Dashboards and live reporting
During a campaign, a live dashboard helps the team spot problems and opportunities early. Useful dashboards show progress toward each KPI target, spend against budget, the status of each creator and the top-performing posts, updated daily or weekly. Keep dashboards focused: a dozen well-chosen numbers are more useful than a hundred charts. Agree who looks at the dashboard, how often and what actions are triggered by particular results, for example moving amplification budget when a post's CPA falls below target.
Dashboards and reports should use the same definitions and sources so that numbers do not change between the live view and the final report. If data sources disagree, for example the affiliate platform and web analytics count different numbers of orders, show both and explain the difference rather than quietly picking the higher figure.
Benchmarking over time
A single campaign report says how one campaign went. A series of reports, using consistent definitions, shows whether the program is improving. Track key figures such as cost per thousand target people reached, CPA, incremental ROAS, compliance rate and share of creators rehired across campaigns. Over a year or two, these internal benchmarks become far more useful than published industry averages, because they reflect the brand's own products, prices and audiences. They also make it easier to set realistic targets for the next campaign, closing the loop that began with Lesson 2.
Reporting to different audiences
Different stakeholders need different levels of detail. Senior leaders want the executive summary: were objectives met, what did it cost and what should we do next? The marketing team wants creator-level and content-level insights to improve the next campaign. Finance wants full costs, payment status and return calculations it can check. Legal and compliance want the disclosure rate and any issues. Preparing a short summary for leaders and a detailed appendix for specialists serves everyone without overwhelming anyone.
Whatever the audience, keep the numbers consistent between versions of the report, so that a figure quoted by the chief executive matches the figure in the analyst's appendix.
Common mistakes
MistakeRelying on unverified screenshots taken at random times.
InsteadSpecify metrics, timing and format in contracts and use first-party data where possible.
MistakeConfusing ROAS with ROI.
InsteadUse gross profit and full costs to calculate ROI, and state break-even ROAS.
MistakePresenting EMV as the campaign's return.
InsteadLead with objective-linked metrics such as lift, CPA and ROI.
MistakeRanking creators on a single metric.
InsteadCompare creators on the metric that matches each future objective.
MistakeHiding missed targets behind vanity metrics.
InsteadReport results against targets honestly, with learnings.
Summary and key terms
- Collect first-party data where possible and report at fixed intervals such as 7 and 30 days.
- Calculate costs per result using full creator costs.
- ROAS = revenue ÷ spend; ROI = (gross profit − spend) ÷ spend; break-even ROAS = 1 ÷ gross margin.
- Lifetime value gives a fuller view for repeat-purchase businesses.
- Earned media value has no standard method and is not a return.
- Value reusable content as cost avoided, separately from revenue.
- Use post-campaign creator scorecards and honest, structured reports.
- First-party data
- Data shared directly from the platform.
- ROAS
- Return on ad spend: revenue divided by spend.
- ROI
- Return on investment: profit after costs divided by spend.
- Gross margin
- Revenue minus cost of goods, as a share of revenue.
- Break-even ROAS
- The ROAS at which gross profit equals spend.
- Customer lifetime value
- Gross profit a customer generates over the relationship.
- Earned media value
- An estimated dollar value of attention, without a standard method.
- Cohort
- A group of customers acquired in the same period or way.
- Creator scorecard
- A post-campaign comparison of creators.
- Executive summary
- A one-page overview of results and recommendations.
Practice problems
Work each problem on paper first, then reveal the answer to check.
Why report at fixed intervals after posting?
Show answer
Views accumulate over time, so comparisons need the same window.
Revenue $90,000, spend $30,000. ROAS?
Show answer
3.0.
Same campaign, 40 % margin. ROI?
Show answer
(36,000 − 30,000) ÷ 30,000 = 20 %.
Break-even ROAS at 25 % margin?
Show answer
4.0.
800 new customers, LTV gross profit $60, spend $30,000. Lifetime ROI?
Show answer
(48,000 − 30,000) ÷ 30,000 = 60 %.
Give two problems with EMV.
Show answer
No standard method; measures cost of attention, not business value.
How should reusable content be valued?
Show answer
As cost avoided, separately from revenue.
Cost $4,000, 100 purchases. CPA?
Show answer
$40.
Name four sections of a campaign report.
Show answer
Summary, KPI results, cost efficiency, incrementality, insights, compliance, learnings.
Why share results with creators?
Show answer
It helps them improve and builds goodwill.
Lesson quiz · 5 questions
Score 60% or more to complete this lesson.
Create a free account to save your progress, take quizzes and earn a certificate.