
CRE-230 · Lesson 1 of 12 · 25 min
Designing for the feed
Every image a creator publishes competes with an endless stream of other images. On a phone, a post appears for a fraction of a second as the viewer scrolls, often at a size smaller than a playing card, surrounded by interface buttons, captions and other people's content. Graphic design for social media is the craft of making visual content that works in that environment: graphics that stop the scroll, communicate quickly, stay legible at small sizes, look consistent with a creator's brand and remain accessible to everyone. VIS-101 covered the elements and principles of visual design in general. This course applies them to the specific formats of social platforms: feed posts, thumbnails, covers, carousels, stories, banners, infographics and simple motion graphics. This first lesson looks at how people view graphics in feeds, the jobs a social graphic has to do, the formats and dimensions of the main platforms, and a simple process for designing any social graphic.
How people see graphics in a feed
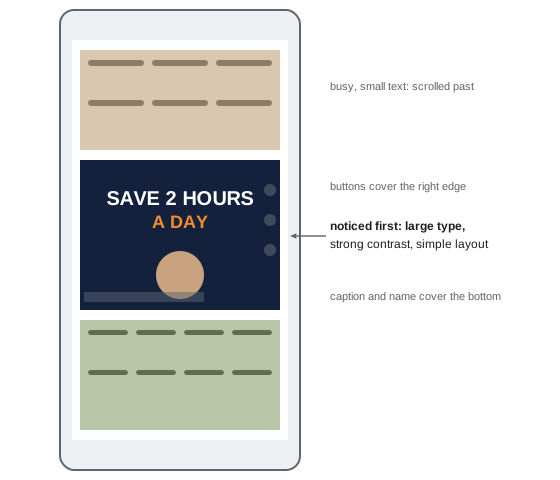
Research on screen reading and eye tracking, and the experience of designers testing their own work, point to a few consistent behaviors. People scroll quickly and decide in well under a second whether something deserves attention. They notice large shapes, strong contrast, faces and bright, saturated color before details. They read only a few words at first glance, usually the largest ones. They view content on small screens, often outdoors in bright light or in dim rooms at night, frequently with reduced screen brightness. Many people use dark mode, which changes how graphics with white backgrounds appear. And the interface itself covers parts of every post: profile names, captions, buttons and progress bars.
These conditions favor graphics that are simple, bold and immediately readable. A design that looks elegant on a large monitor during editing can disappear on a phone. A useful discipline is to design at full resolution but judge the result at the size it will actually be seen: on your phone, in the app, among other posts.
The jobs of a social graphic
Before designing anything, decide what the graphic must do. Most social graphics have one or more of these jobs:
- Stop the scroll: make someone pause on this post rather than the next.
- Communicate the main idea quickly: tell the viewer what the post or video is about in a few words and an image.
- Invite action: encourage a tap, a swipe to the next slide, a save, a share, a click or a comment.
- Teach or explain: present information clearly, as in tips, steps, comparisons and data.
- Build recognition: make the creator or brand identifiable at a glance through consistent colors, type and layout.
A thumbnail mainly needs to stop the scroll and communicate the idea; a carousel slide may need to teach; a quote graphic may need to build recognition. Trying to do everything in one graphic usually produces clutter. Choose the primary job and design for it.
Formats and dimensions
Each platform and placement has preferred dimensions and aspect ratios. Specifications change frequently, so always check the current guidance before a campaign, but typical values at the time of writing are:
| Placement | Aspect ratio | Typical size (pixels) |
|---|---|---|
| Instagram and Facebook feed post (portrait) | 4:5 | 1080 × 1350 |
| Instagram profile grid preview | 3:4 | Crop of the post, about 1080 × 1440 view |
| Stories, Reels and TikTok covers | 9:16 | 1080 × 1920 |
| YouTube video thumbnail | 16:9 | 1280 × 720 (minimum width 640) |
| LinkedIn and X link or feed image | About 1.91:1 or 16:9 | 1200 × 627 or 1600 × 900 |
| Pinterest standard pin | 2:3 | 1000 × 1500 |
| YouTube channel banner | 16:9 with a central safe area | 2560 × 1440, safe area 1546 × 423 |
Designing at these sizes, or at double the size for sharper results on high-density screens where platforms allow, avoids unexpected cropping. Remember that platforms compress uploaded images, so fine detail, small text and subtle gradients may degrade.
Worked problem
Planning one idea across formats
A fitness creator wants to promote a new "10-minute morning stretch" video with a YouTube thumbnail, an Instagram feed post and a story. What sizes are needed, and what changes between them?
Show solution
- YouTube thumbnail: 1280 × 720 (16:9); large face and stretch pose, three to four words of text.
- Instagram feed post: 1080 × 1350 (4:5); same photo cropped taller, headline at the top, important content kept inside the 3:4 grid crop.
- Story: 1080 × 1920 (9:16); photo extended or placed on a colored background, headline in the upper middle, a link sticker area left clear, top and bottom margins kept free of text.
- Keep the colors, typefaces and photo consistent so the three graphics are recognizably related.
Answer: Three sizes (1280 × 720, 1080 × 1350 and 1080 × 1920), each recomposed for its frame and safe areas, with consistent brand elements.
Pixels, resolution and screens
Social graphics are measured in pixels. Resolution in pixels per inch matters only for print, so a 72 or 300 ppi setting makes no difference to how a graphic displays on screen (VIS-120 explains why). What matters is the pixel dimensions and how the platform scales them. Phones have high pixel densities: a modern phone may display about 400 to 500 pixels per inch, and a 1080-pixel-wide image fills the width of the screen. Text that is 30 pixels tall in a 1080-pixel-wide graphic appears roughly as large as normal body text on the phone, while text 15 pixels tall becomes hard to read. A practical rule for feed graphics is to keep important text at least 40 to 50 pixels tall at 1080 pixels wide, and headlines much larger.
Safe areas and interface overlays
Platforms overlay their interface on top of content. In vertical video and stories, the top contains progress bars and the profile name, the bottom contains captions, music information and reply fields, and the right side contains buttons. Feed posts may be cropped in the profile grid. Thumbnails display a duration label in a corner. Design with these overlays in mind: keep faces, text and logos inside a central safe area, and test by viewing the graphic inside the app or with a template overlay that marks the hidden areas. CRE-130 covered safe zones for vertical video; the same thinking applies to every graphic format.
A design process for social graphics
A simple, repeatable process helps produce good graphics quickly:
- Brief: write one sentence stating the purpose, audience, platform and primary job of the graphic.
- Message: write the words first, reduced to the essential few, before opening a design tool.
- Sketch: make two or three rough thumbnails on paper or in the app, trying different layouts.
- Build: create the graphic at the correct size using your brand typefaces, colors and templates.
- Test: view it at actual size on a phone, in light and dark mode, and check legibility, contrast and safe areas.
- Refine: simplify, increase contrast, enlarge the main element and remove anything that does not serve the job.
- Export and publish: export at the right size and format, add alt text, and publish.
- Learn: review performance and note what worked.
The process takes only minutes for simple graphics once it becomes habit, and it prevents the most common problems: too many words, low contrast and poor cropping.
Design tools
Creators use a range of design tools. Browser and app-based tools such as Canva and Adobe Express offer templates, brand kits and quick resizing for many platforms, making them popular with solo creators and small teams. Professional tools such as Adobe Photoshop, Illustrator and InDesign, Affinity Designer and Photo, and Figma offer more control over layout, vector graphics, typography and collaboration. Phone apps allow quick edits on the go. The principles in this course apply whatever the tool: a well-designed graphic made in a simple app outperforms a cluttered one made in professional software. Learn one tool well, including its alignment, grid, layer and export features, before adding others.
Design and platform culture
Each platform has its own visual culture. Instagram favors polished, aesthetic images and carousels; TikTok favors native-feeling, informal visuals and on-screen text; LinkedIn favors clean, professional graphics, documents and charts; Pinterest favors tall, text-overlaid images that work like visual search results; YouTube thumbnails favor bold faces, objects and a few large words. Graphics that look out of place can feel like advertisements and be scrolled past. Studying what performs well in your niche on each platform, without copying, helps you design graphics that feel native while still being distinctive.
Ethics and honesty in design
Graphics shape what viewers expect. A thumbnail or cover that promises something the content does not deliver may earn clicks but damages trust and can harm retention and recommendations. Graphics presenting data must not distort it (Lesson 8), and sponsored graphics must make the commercial relationship clear (Lesson 12 and CRE-320). Design honestly: attractive, clear and accurate.
Native and polished design
A recurring debate in creator design is how polished graphics should be. Highly designed graphics signal professionalism and work well for educational carousels, brands and launches, but in some feeds they read as advertisements and are skipped. Informal, native-looking graphics, such as text typed in the platform's own tools, handwritten notes, screenshots and phone photos, can feel more personal and trustworthy, especially on TikTok and in stories. Many successful creators mix both: a consistent, polished system for evergreen content and covers, and quicker, informal graphics for timely updates and behind-the-scenes posts. The right balance depends on the niche, the platform and the audience; testing both approaches and comparing performance helps decide.
Designing for scanning, not reading
Most viewers scan graphics rather than read them. They look at the largest words, the image and perhaps one more element before deciding. Designing for scanning means front-loading meaning: the first words of a headline should carry the idea, numbers should be written as numerals because they catch the eye, and key words can be highlighted. It also means accepting that most details will not be read in the feed; they belong in the caption, a later carousel slide or a linked resource. A graphic that communicates its point in a two-second glance has done its main job.
A first-glance checklist
Before publishing any graphic, ask: what will someone notice in the first second; is the main idea readable at actual size; does the graphic look like it belongs to my brand; does it work in light and dark mode; is anything important under an interface element; is the text accurate and free of errors; and have I added alt text and any required disclosure? These questions take a minute and prevent most problems. Over time they become automatic, and the course's later lessons explain each one in more depth.
Learning from the feed
One of the best ways to improve is to study graphics in your own feed deliberately. When a post makes you stop, take a screenshot and note why: was it the color, a face, a surprising number, a bold headline or white space? When you scroll past something, ask what made it forgettable. Keep these examples in a reference folder, organized by format and technique, and revisit them when designing. Look beyond your niche too, since ideas from other fields, such as magazine covers, packaging, posters and signage, can make your work stand out.
Design and performance data
Analytics show which graphics work. Compare saves, shares, profile visits and click-through rates across graphic styles, keeping other factors as similar as possible, and look for patterns over several posts rather than single results (CRE-202). Design decisions informed by evidence, combined with the principles in this course, improve steadily over time.
Common mistakes
MistakeJudging designs only on a large monitor.
InsteadCheck every graphic at actual size on a phone.
MistakeTrying to make one graphic do every job.
InsteadChoose the primary job and design for it.
MistakeUsing one size for every platform.
InsteadRecompose for each aspect ratio and safe area.
MistakeSmall text that disappears on phones.
InsteadKeep key text at least 40–50 px tall at 1080 px wide.
MistakeIgnoring interface overlays.
InsteadKeep key content inside the safe area.
Summary and key terms
- Feeds reward graphics that are simple, bold and readable at small sizes.
- Decide the primary job: stop, communicate, invite, teach or build recognition.
- Use current platform dimensions and aspect ratios for each placement.
- Pixel dimensions matter on screen; ppi settings do not.
- Keep key content inside safe areas and away from interface overlays.
- Follow a quick process: brief, message, sketch, build, test, refine, export, learn.
- Respect platform culture and design honestly.
- Feed
- Scrolling stream of posts on a platform.
- Scroll-stopping
- Able to make a viewer pause on a post.
- Aspect ratio
- Ratio of width to height of a graphic.
- Safe area
- Region not covered by interface elements or crops.
- Pixel density
- Number of pixels per inch on a display.
- Compression
- Reduction of file size, often losing detail.
- Design brief
- Statement of purpose, audience and platform.
- Thumbnail sketch
- Small rough drawing of a layout idea.
- Dark mode
- Interface setting with dark backgrounds.
- Platform culture
- Visual conventions typical of a platform.
Practice problems
Work each problem on paper first, then reveal the answer to check.
Name three behaviors of people viewing feeds.
Show answer
Fast scrolling, notice contrast and faces, read few words, small screens.
List the five jobs of a social graphic.
Show answer
Stop, communicate, invite action, teach, build recognition.
Size of a portrait Instagram feed post?
Show answer
1080 × 1350 (4:5).
Size of a YouTube thumbnail?
Show answer
1280 × 720.
Does a 72 ppi setting affect screen display?
Show answer
No.
Minimum height for key text at 1080 px wide?
Show answer
About 40–50 px.
What covers the bottom of a story?
Show answer
Captions, reply fields and music information.
What is the first step of the design process?
Show answer
Write a brief.
Why write the words first?
Show answer
To reduce the message before designing.
How does LinkedIn visual culture differ from TikTok?
Show answer
More polished and professional versus informal and native.
Lesson quiz · 5 questions
Score 60% or more to complete this lesson.
Create a free account to save your progress, take quizzes and earn a certificate.