
COMP-111 · Lesson 5 of 12 · 22 min
The value of data
▶ Video coming soon A video version of this lesson is on the way.
The library board has asked a question that lands on Marcus Bell's desk and then, by way of Lorna, on the cert club table: should Fairhaven keep its branch hours the same next year? Marcus has the data to help answer it, including door counts from sensors at every entrance, circulation records, Wi-Fi connection counts, program sign-ins and room bookings, but the data on its own is not an answer. "Data is raw facts," he says. "Information is data organized so that someone can make a decision with it. My job is turning one into the other without letting anyone's private details leak along the way." This lesson covers why data has value, how organizations collect and use it to make decisions, the forms of intellectual property that protect what they create, and why data must be protected as carefully as any other asset.
Data, information and knowledge
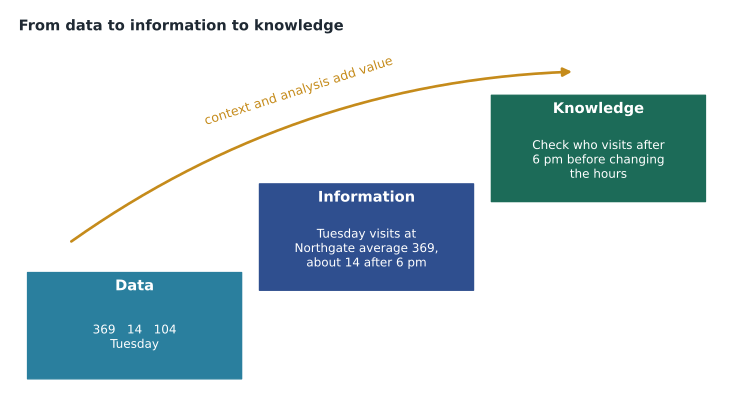
Data is a collection of raw facts and figures with no context: 369, 14, 104, Tuesday. Information is data that has been processed, organized and given context so that it means something: on Tuesdays in October, Northgate averaged 369 visits between 10:00 and 20:00, but only about 14 of them came after 18:00. Knowledge goes one step further, combining information with experience to understand what it implies and what to do: evening visits at Northgate are low enough that shorter Tuesday hours would affect few people, but the board should check who those evening visitors are before deciding, because they may have no other time to come. Tech+ expects you to know that data becomes valuable when it is turned into information that supports decisions.
Data as an asset
Organizations increasingly treat data as an asset, something with value that must be acquired, maintained and protected, much like buildings or equipment. A retailer's purchase history lets it predict demand and stock the right items. A transit agency's ridership data shows where to add buses. A hospital's records support patient care and research. The library's circulation history shows which collections are used and which sit untouched, which guides how the materials budget is spent. Because data has value, losing it costs money, and because some of it is personal, exposing it causes harm and legal trouble.
Some organizations go further and make money from data directly, which is called data monetization. They may sell anonymized market data, sell advertising aimed at particular audiences, or offer a premium product built on data they collect, such as traffic predictions or credit scores. Monetization raises sharp privacy questions, and laws in many places restrict what can be sold and require consent. Public bodies such as libraries do not sell patron data at all, and professional ethics in librarianship treat what a person borrows as private. For the exam, recognize monetization as one way data creates value, and recognize that the value comes with obligations.
Data-driven business decisions
Making decisions with data follows a recognizable path. First, data must be captured and collected, ideally on purpose: decide what question you need to answer, then gather data that can answer it, rather than collecting everything and hoping. Collection methods include sensors such as door counters, transaction records such as checkouts, forms and surveys, website and app analytics, and data bought or shared from outside sources. The quality of the decision can never be better than the quality of the data: incomplete, out-of-date or inconsistent data leads to confident but wrong conclusions.
Next, the data is analyzed for patterns. Correlation means two measures move together, such as evening visits and the number of evening programs. Correlation is useful, but it does not prove that one causes the other: visits may be low because there are few programs, or programs may have been cut because visits were low, or both may follow something else, such as the time the last bus runs. Good analysts look for correlations and then test explanations before acting on them. Finally, the results must be reported meaningfully: clear charts, plain summaries and the limitations stated, so that the people deciding understand both what the data shows and what it cannot show.
# Average visits by hour block at Northgate on October Tuesdays (illustrative data)
visits = {
    "10:00-12:00": [61, 58, 66, 70],
    "12:00-14:00": [88, 92, 85, 90],
    "14:00-16:00": [97, 101, 95, 99],
    "16:00-18:00": [104, 96, 110, 108],
    "18:00-20:00": [15, 12, 17, 13],
}
day_total = sum(sum(v) for v in visits.values()) / 4
for block, counts in visits.items():
    avg = sum(counts) / len(counts)
    share = round(avg / day_total * 100)
    print(f"{block}  average {avg:5.1f} visits  about {share} in every 100 of the day")
print(f"Average Tuesday total: {day_total:.0f}")10:00-12:00 average 63.8 visits about 17 in every 100 of the day 12:00-14:00 average 88.8 visits about 24 in every 100 of the day 14:00-16:00 average 98.0 visits about 27 in every 100 of the day 16:00-18:00 average 104.5 visits about 28 in every 100 of the day 18:00-20:00 average 14.2 visits about 4 in every 100 of the day Average Tuesday total: 369
What this code does
It takes four Tuesdays of door-counter readings, split into two-hour blocks, and works out the average visits in each block and for the whole day. It then expresses each block as a share of the day, in visits out of every 100. The output shows that the last two hours bring in only about 4 visits in every 100, which is information the board can use, while the raw counts alone were just numbers.
Marcus's report to the board will show this table alongside a caution: four Tuesdays is a small sample, October may not represent the whole year, and door counters cannot say who visited or why. He recommends a short survey of evening visitors before any change. That is what meaningful reporting looks like: the numbers, what they suggest and what they do not prove.
Data quality
Analysts judge data by a few qualities before trusting it. Accuracy asks whether the values are correct: a door counter that also counts staff going in and out for breaks overstates visits. Completeness asks whether anything is missing, such as a week when one sensor was unplugged. Consistency asks whether the same thing is recorded the same way everywhere, such as every branch using the same program categories. Timeliness asks whether the data is current enough for the decision; last year's figures may not reflect a new bus route. Validity asks whether values fit the expected format and range, which is the input validation idea from lesson 2. Marcus checks each of these before a report goes to the board, and his report says plainly where the data falls short, because a decision built on flawed data is worse than a decision made knowing the data is limited.
Reports and dashboards are the two common ways of sharing information. A report is a document prepared for a particular question and audience at a particular time, such as Marcus's paper to the board. A dashboard is a live screen of key measures, such as daily visits, checkouts and Wi-Fi sessions by branch, that updates automatically and lets managers spot a change as it happens. Both work best when they show a few measures that matter, label units and time periods clearly and make comparisons easy, rather than filling the screen with every number available.
Intellectual property
Organizations also create value that is not data: logos, software, books, inventions, recordings and designs. Intellectual property, or IP, is the set of legal protections for creations of the mind. Tech+ expects you to compare three main types and to know what each protects. The details vary by country, but Canada and the United States work in broadly similar ways.
| Type | What it protects | How it is obtained | How long it lasts |
|---|---|---|---|
| Copyright | Original creative works: writing, software code, music, film, photos, artwork | Automatically, as soon as the work is created in a fixed form; registration is optional but helps in disputes | Generally the creator's life plus 70 years |
| Trademark | Names, logos, slogans and symbols that identify a brand | By use in commerce, and more strongly by registration | As long as it is used and renewed |
| Patent | Inventions: new, useful, non-obvious processes, machines or devices | By applying to the national patent office and being granted | Generally 20 years from filing |
Copyright protects the expression of an idea, not the idea itself. Dez's kiosk script is protected by copyright as code, and the library owns that copyright because he wrote it as part of his job, but anyone may write their own script that does the same thing. A trademark protects identity: the Fairhaven Regional Library name and logo identify the library, and another organization cannot use a confusingly similar logo. A patent protects how an invention works and gives its owner the right to stop others making, using or selling it for a limited time, in exchange for publishing how it works. Software can sometimes be patented when it is part of a genuine technical invention, though the rules are narrower than for physical inventions.
Licensing is how IP owners let others use their work under set conditions. Software licenses, covered in COMP-110, are copyright licenses. A digital product, such as an e-book, a streaming film or an app, is usually licensed rather than sold: the buyer gets the right to use it on the license's terms, not ownership of a copy. That is why libraries lend e-books under publisher licenses that may limit how many patrons can borrow a title at once, or how many times it can be lent before the library must buy it again. Copying digital products outside the license, such as sharing a paid app or removing copy protection, may infringe copyright even though the copy costs nothing to make.
Protecting data
Because data is valuable, it is worth protecting, and investing in its security is a business decision like insuring a building. A breach of personal data can lead to fines, lawsuits, the cost of notifying people and offering credit monitoring, and lasting loss of trust. Lost data, from a failed drive with no backup or a ransomware attack, can stop an organization working entirely. The security lessons later in this course cover how; the point here is why. The more valuable or sensitive the data, the more care it deserves, which is why organizations classify data, for example as public, internal, confidential or restricted, and protect each class accordingly.
Privacy law adds a legal duty. The United States has no single national privacy law for all personal data; instead it has federal laws for particular kinds of data, such as health records under HIPAA and children's data under COPPA, plus a growing set of state privacy laws such as the California Consumer Privacy Act. Nearly every state, Washington among them, also has a law that keeps library patron records confidential. The common principles are to collect only what is needed for a stated purpose, get consent where required, keep it secure, keep it no longer than necessary and let people see what is held about them. Library records also carry a professional duty of confidentiality: what a patron borrows or searches for is nobody else's business.
Worked problem
Planning the evening survey
The board approves Marcus's idea of a short survey of evening visitors at Northgate. Hana asks him to design it so that it answers the question without creating a privacy problem. What should the plan include?
Show solution
- State the purpose: to understand who visits after 18:00 and whether shorter hours would leave them without another option.
- Collect only what serves that purpose: the reason for the visit, whether the visitor could come earlier and a rough age group, with no names, card numbers or contact details.
- Make the survey voluntary and say how the answers will be used and how long they will be kept.
- Store the results with the library's other internal data, limit access to the people analyzing them, and delete the raw responses once the summary report is accepted.
- Report the results as totals and shares, never as individual answers that could identify someone.
Answer: A purpose-driven, minimal, voluntary survey with no identifying details, limited access, a deletion date and reporting only in aggregate.
Common mistakes
MistakeTreating data and information as the same thing.
InsteadData is raw facts; information is data organized with context for a decision.
MistakeAssuming correlation proves cause.
InsteadTwo measures moving together may share a third cause; test explanations first.
MistakeThinking copyright protects ideas.
InsteadCopyright protects the expression, such as the code, not the underlying idea.
MistakeConfusing trademarks with patents.
InsteadTrademarks protect brand identity; patents protect inventions.
MistakeCollecting everything "just in case."
InsteadCollect what the purpose needs; extra personal data is extra risk.
Summary and key terms
- Data is raw facts; information is data processed and given context; knowledge applies it to decisions.
- Data is an asset with value, and some organizations monetize it, subject to law and consent.
- Data-driven decisions need purposeful collection, careful analysis and meaningful reporting.
- Correlation shows things move together; it does not prove that one causes the other.
- Copyright protects creative works, trademarks protect brand identity, and patents protect inventions.
- Digital products are usually licensed, not owned.
- Valuable and personal data must be protected; privacy laws require purpose, consent, security and limits.
- Data
- Raw facts and figures without context.
- Information
- Data organized and processed so it has meaning.
- Data monetization
- Earning revenue from data or products built on it.
- Correlation
- A relationship in which two measures tend to change together.
- Copyright
- Legal protection for original creative works, automatic on creation.
- Trademark
- Legal protection for a name, logo or symbol that identifies a brand.
- Patent
- A limited-time right to stop others using a registered invention.
- Digital product
- A product delivered electronically, usually under a license.
Practice problems
Work each problem on paper first, then reveal the answer to check.
What turns data into information?
Show answer
Organizing and processing it so it has context and meaning.
Which type of IP protects a company logo?
Show answer
A trademark.
Which type of IP applies automatically when software is written?
Show answer
Copyright.
Roughly how long does a patent last?
Show answer
About 20 years from filing.
Two measures rise and fall together. What can you conclude?
Show answer
That they are correlated; not, by itself, that one causes the other.
Why do libraries lend e-books under limits?
Show answer
E-books are licensed digital products, and the license sets the terms.
Lesson quiz · 5 questions
Score 60% or more to complete this lesson.
Create a free account to save your progress, take quizzes and earn a certificate.