
CMP-350 · Lesson 7 of 12 · 22 min
Power in CMOS: dynamic power, leakage and scaling
Power decides the battery life of a sensor node, the heat sink of a server and the size of the regulator on every board. CMOS logic became dominant because an idle static gate draws almost nothing, yet a busy chip can dissipate tens or hundreds of watts. This lesson breaks CMOS power into its components, shows how each depends on voltage, frequency, temperature and design choices, and connects the circuit-level picture to the system-level budgets that CMP-315 built for the Northway Sensing NS-5.
Where the power goes
Total power in a CMOS circuit has three parts. Dynamic switching power is spent charging and discharging capacitance each time a node toggles. Short-circuit power flows briefly through both networks of a gate while its input passes through the middle of the transfer curve, as lesson 4 showed. Static power is drawn even when nothing switches: subthreshold leakage through transistors that are nominally off, gate leakage through very thin oxides, junction leakage, and any intentional static current such as pull-up resistors or analog bias circuits.
In the dynamic term, C is the total switched capacitance, f is the clock frequency and α is the activity factor, the average fraction of that capacitance that charges per clock cycle. A clock net toggles every cycle, so its α is 1 in this convention; ordinary logic often has α of 0.05 to 0.2. The derivation is direct: each time a node charges from 0 to V_DD, the supply delivers charge CV_DD at voltage V_DD, an energy of CV_DD², half of which is stored on the capacitor and half dissipated in the pull-up network. When the node discharges, the stored half is dissipated in the pull-down network. The resistance of the transistors does not appear, which is why making transistors stronger does not reduce dynamic energy.
| Component | Depends on | Typical way to reduce it |
|---|---|---|
| Dynamic switching | α, C, V_DD², f | Lower voltage, clock gating, less switched capacitance |
| Short-circuit | Input edge rate, V_DD, sizing | Sharp input edges, balanced sizing |
| Subthreshold leakage | V_t, temperature, V_DD (through DIBL) | Higher-V_t devices, power gating, cooler operation |
| Gate leakage | Oxide thickness, V_DD | High-k gate dielectrics |
| Intentional static current | Pull-ups, references, bias | Larger resistors, duty-cycled analog blocks |
Voltage is the strongest lever
Because dynamic energy per operation scales with V_DD², halving the supply cuts switching energy by a factor of four. The catch, from lessons 3 and 6, is that lower voltage also makes gates slower, so the maximum clock frequency falls. Dynamic voltage and frequency scaling exploits the trade: when the workload is light, the system lowers both frequency and voltage; when it needs speed, it raises them. Lowering frequency alone reduces power but not the energy of a fixed task, because the task simply takes longer. Lowering voltage with it reduces the energy as well.
Worked problem
Power of a microcontroller core
The NS-5 microcontroller core switches an effective 80 pF per cycle, activity included, at 1.2 V and 48 MHz. Find the core power and current, and compare the battery-side power if the core supply comes from a linear regulator on the 3.3 V rail or from a 90 percent efficient buck converter.
Show solution
- \[ P = 80\,\text{pF} \times (1.2\,\text{V})^2 \times 48\,\text{MHz} = 5.53\ \text{mW}\]
- \[ I_{\text{core}} = \frac{5.53\,\text{mW}}{1.2\,\text{V}} = 4.61\ \text{mA}\]
- \[ P_{\text{LDO}} = 4.61\,\text{mA} \times 3.3\,\text{V} = 15.2\ \text{mW}, \qquad P_{\text{buck}} = \frac{5.53\,\text{mW}}{0.9} = 6.1\ \text{mW}\]
Answer: A linear regulator passes the same current it delivers, so it wastes the voltage difference: the battery side sees 15.2 mW for 5.5 mW of useful core power. A buck converter cuts that to about 6.1 mW. Many low-power microcontrollers include an internal switching regulator for exactly this reason, although at very low sleep currents a linear regulator can win because the switcher’s own quiescent current dominates.
Leakage and temperature
Lesson 3 showed that subthreshold current falls by a factor of ten for every 60 to 100 mV of gate voltage below threshold. A transistor that is nominally off therefore still conducts a small current, and a chip with hundreds of millions of transistors adds those currents into milliamps. Leakage rises steeply with temperature, because the threshold voltage falls and the subthreshold slope degrades as the chip warms; as a rule of thumb it often doubles for every 10 to 20 °C. A sensor node that sleeps at 2 µA on the bench can draw several times that in an enclosure baking in summer sun, which is why a sound power budget uses the leakage figure at the highest operating temperature, not the typical value.
Leakage also depends on the supply voltage through drain-induced barrier lowering, and on the stack of transistors in the off network: two series off-transistors leak much less than one, because the node between them rises slightly and reverse-biases the upper device. Designers use several techniques to control leakage. Multi-threshold libraries offer high-V_t cells, which are slower but leak far less, for paths that are not timing-critical. Power gating disconnects an idle block from its supply with a large header or footer switch, reducing its leakage to almost nothing at the cost of losing its state and needing time to wake. Retention flip-flops keep a little state alive on a separate always-on supply so a block can resume quickly after gating. Body biasing shifts thresholds at run time.
Reducing dynamic power
The dynamic term offers more levers than voltage. Clock gating stops the clock to registers whose contents will not change, removing their clock-pin switching, which in many designs is a third or more of the dynamic power. Microcontrollers expose this to firmware as peripheral clock-enable bits: a timer or UART whose clock is off draws only leakage. Reducing switched capacitance through smaller gates, shorter wires and fewer glitches helps directly. Glitches, the spurious transitions that occur when inputs to a gate arrive at different times, can account for a surprising share of dynamic power in arithmetic circuits and are reduced by balancing path delays.
Input and output pins deserve their own attention, because board capacitance is enormous compared with on-chip nodes. A pin driving a 13 pF trace at 3.3 V spends CV² = 0.14 nJ per full cycle. Toggling at 1 MHz that is 0.14 mW; an SPI clock at 8 MHz costs 1.1 mW; at 24 MHz, 3.4 mW, more than half the power of the whole core in the example above. Lowering the I/O voltage, shortening and narrowing traces, and turning off clocks to external devices between transfers all pay off.
Worked problem
Energy of a flash write burst
Maren Holt's firmware writes a 256-byte page to the NS-5 external flash every 15 minutes over SPI at 8 MHz. The command, address and data total 260 bytes. The clock line and data lines together switch about 13 pF at 3.3 V; take the clock as α = 1 and the data line as α = 0.5 relative to the clock rate. Estimate the switching energy on the bus per page write.
Show solution
- \[ t = \frac{260 \times 8}{8\,\text{MHz}} = 260\ \mu\text{s}\]
- \[ P_{\text{clk}} = 13\,\text{pF} \times 3.3^2 \times 8\,\text{MHz} = 1.13\ \text{mW}, \qquad P_{\text{data}} \approx 0.5 \times 1.13 = 0.57\ \text{mW}\]
- \[ E = (1.13 + 0.57)\,\text{mW} \times 260\,\mu\text{s} \approx 0.44\ \mu\text{J}\]
Answer: About 0.44 µJ per write, or roughly 42 µJ per day at 96 writes. That is negligible beside the flash memory’s own programming energy and the modem bursts in the NS-5 budget, but the same calculation for a continuously running 24 MHz display bus would not be negligible.
The minimum-energy point
If voltage is lowered far enough, gates become so slow that leakage, which flows for the whole of each slow clock cycle, starts to dominate the energy of each operation. Dynamic energy falls as V², but leakage energy per operation rises as the cycle time stretches. The total therefore has a minimum, usually a little above the threshold voltage. Circuits designed for that region, called near-threshold or subthreshold design, can reach remarkable efficiency for slow workloads such as sensor processing, though variation and noise make them harder to design.
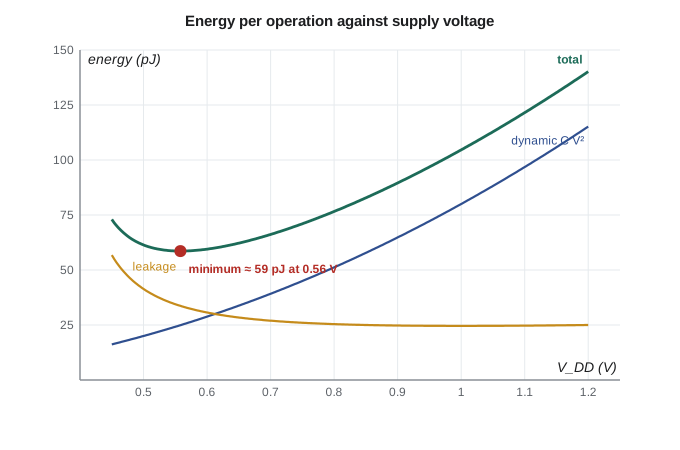
The code at the end of the lesson computes this curve for a block switching 80 pF per cycle with 1 mA of leakage, a level typical of a larger logic block running warm. With these parameters the minimum, about 59 pJ per operation, sits near 0.55 V, where the block runs at only 16 MHz. At 1.2 V and 48 MHz the energy is more than twice as high. Whether the low-voltage point is worth using depends on whether the work can tolerate the lower speed, and on the race-to-sleep argument from CMP-315: if the rest of the system can sleep deeply once the work is done, finishing quickly at a higher voltage may cost less in total.
Scaling: from Dennard to dark silicon
For about three decades, each process generation shrank transistor dimensions by about 0.7 and lowered the supply voltage in proportion. Under this Dennard scaling, transistors got faster and smaller and the power per unit area stayed roughly constant, so chips could hold twice as many transistors at higher clock rates without running hotter. In the mid-2000s the scheme stopped working. Threshold voltages could not keep falling without leakage exploding, so supply voltages stalled near 1 V while transistor counts kept doubling. Power density rose, clock frequencies flattened at a few gigahertz, and the industry turned to multiple cores, specialized accelerators and aggressive power management.
Today a large chip cannot power all of its transistors at full speed at once, a situation called dark silicon. Designers fill the area with specialized blocks that are each powered only when needed. The same thinking runs down to small microcontrollers, which pair a capable core with low-power peripherals that can collect sensor data, run timers and move data by direct memory access while the core sleeps. The skills of this lesson, estimating αCV²f, recognizing leakage at temperature and choosing the right supply arrangement, carry straight into those choices.
| Era | Supply voltage | Main power concern | Design response |
|---|---|---|---|
| Before about 2005 | Scaled with dimensions | Dynamic power, held in check by scaling | Higher clock rates |
| After about 2005 | Near 1 V and flat | Power density and leakage | Multicore, clock and power gating, DVFS |
| Today | Below 1 V in advanced nodes | Dark silicon, thermal limits | Accelerators, fine-grained power domains |
Computing power with code
The code calculates the core example, the cost of driving a board-level trace at several frequencies, and the energy per operation of a logic block as the supply is swept. It models delay with the alpha-power law from lesson 3 and adds leakage energy for each cycle.
# Dynamic power, supply scaling and energy per operation in CMOS
def p_dyn(alpha_c, v, f):
    return alpha_c * v * v * f          # alpha_c = activity times switched capacitance

# microcontroller core: 80 pF switched per cycle (activity included), 1.2 V, 48 MHz
P = p_dyn(80e-12, 1.2, 48e6)
print(f"core dynamic power {P*1e3:.2f} mW, core current {P/1.2*1e3:.2f} mA")
print(f"battery-side power through a linear regulator from 3.3 V: {P/1.2*3.3*1e3:.1f} mW")
print(f"through a 90% efficient buck converter: {P/0.9*1e3:.1f} mW")

# an output pin toggling a 13 pF trace at 3.3 V; a clock toggles every cycle (alpha = 1)
for f in (1e6, 8e6, 24e6):
    print(f"pin at {f/1e6:4.0f} MHz: {p_dyn(13e-12, 3.3, f)*1e3:.2f} mW")

# energy per operation versus supply: dynamic C V^2 plus leakage over the cycle time
Vt, a, C, I_leak = 0.35, 1.3, 80e-12, 1e-3
t_ref = 1 / 48e6                         # cycle time at 1.2 V
k = t_ref * (1.2 - Vt) ** a / 1.2       # delay ~ k V / (V - Vt)^a
print(" V    f_max(MHz)  E_dyn(pJ)  E_leak(pJ)  E_total(pJ)")
for v in (0.45, 0.5, 0.55, 0.6, 0.7, 0.8, 1.0, 1.2):
    t = k * v / (v - Vt) ** a
    e_d = C * v * v
    e_l = I_leak * v * t
print(f"{v:.2f} {1/t/1e6:9.1f} {e_d*1e12:9.1f} {e_l*1e12:10.1f} {(e_d+e_l)*1e12:11.1f}")core dynamic power 5.53 mW, core current 4.61 mA battery-side power through a linear regulator from 3.3 V: 15.2 mW through a 90% efficient buck converter: 6.1 mW pin at 1 MHz: 0.14 mW pin at 8 MHz: 1.13 mW pin at 24 MHz: 3.40 mW V f_max(MHz) E_dyn(pJ) E_leak(pJ) E_total(pJ) 0.45 7.9 16.2 56.8 73.0 0.50 12.1 20.0 41.4 61.4 0.55 16.0 24.2 34.5 58.7 0.60 19.6 28.8 30.7 59.5 0.70 26.0 39.2 27.0 66.2 0.80 31.5 51.2 25.4 76.6 1.00 40.6 80.0 24.6 104.6 1.20 48.0 115.2 25.0 140.2
The output reproduces the worked examples and the curve in the figure. Changing the leakage current shows how the minimum moves: less leakage pushes the minimum-energy point lower in voltage, while more leakage, at high temperature for example, pushes it higher and makes the low-voltage region less attractive.
Common mistakes
MistakeAssuming that lowering the clock frequency saves energy for a fixed task.
InsteadLower frequency reduces power but stretches the task; only lowering voltage reduces the switching energy of each operation.
MistakeBudgeting sleep current from the typical, room-temperature datasheet value.
InsteadLeakage rises steeply with temperature; budget with the maximum at the hottest operating condition.
MistakeThinking stronger transistors reduce switching energy.
InsteadDynamic energy is CV² per cycle regardless of transistor resistance.
MistakeIgnoring I/O switching.
InsteadBoard traces carry picofarads, so fast external buses can rival the core’s power.
Summary and key terms
- CMOS power is dynamic switching plus short-circuit plus static leakage and bias.
- Dynamic power is αCV²f; half of each CV² is dissipated on charge and half on discharge.
- Voltage is the strongest lever; DVFS lowers voltage and frequency together.
- Leakage grows steeply with temperature and with lower threshold voltages.
- Clock gating, power gating, multi-V_t cells and retention flip-flops reduce power.
- Linear regulators waste the voltage difference; switching converters save it.
- Energy per operation has a minimum near threshold, where leakage starts to dominate.
- The end of Dennard scaling made power the central limit of chip design.
- Activity factor
- The average fraction of a node’s capacitance that charges each clock cycle.
- Dynamic power
- Power spent charging and discharging capacitance as nodes switch.
- Leakage
- Current that flows through transistors and junctions that are nominally off.
- Clock gating
- Stopping the clock to registers that do not need to change.
- Power gating
- Disconnecting an idle block from its supply with a switch transistor.
- DVFS
- Dynamic voltage and frequency scaling, adjusting both to the workload.
- Dennard scaling
- Shrinking dimensions and voltage together so power density stays constant.
- Dark silicon
- Chip area that cannot be powered at full speed simultaneously because of power limits.
Practice problems
Work each problem on paper first, then reveal the answer to check.
A block switches 200 pF at α = 0.1, 1.0 V and 500 MHz. What is its dynamic power?
Show answer
0.1 × 200 pF × 1 × 500 MHz = 10 mW.
The same block moves to 0.8 V at 400 MHz. What is the new power?
Show answer
0.1 × 200 pF × 0.64 × 400 MHz = 5.1 mW, about half.
Leakage doubles every 15 °C. A part leaks 2 µA at 25 °C. Estimate it at 70 °C.
Show answer
45 °C is three doublings: 16 µA.
Why can a linear regulator beat a buck converter at a 1 µA load?
Show answer
The switcher’s quiescent current may exceed the load, while the linear regulator’s loss is only the voltage drop times 1 µA.
Lesson quiz · 5 questions
Score 60% or more to complete this lesson.
Create a free account to save your progress, take quizzes and earn a certificate.