
CIV-390 · Lesson 6 of 12 · 20 min
Signalized intersections
The intersection of Ridgeway Road and Carrick Street is the busiest on the corridor and the source of many complaints: long waits on Carrick in the afternoon, drivers running the yellow, and students who say the walk signal is too short. Traffic signals are the most powerful tool for managing conflicts at busy intersections, but a badly timed signal wastes everyone's time and can make an intersection less safe. This lesson explains how signals allocate time, how a cycle length is chosen, how delay and level of service are estimated, and how the change intervals and pedestrian times are set, and then retimes the signal at Carrick Street.
How a signal works
A traffic signal separates conflicting movements in time. The cycle is one complete sequence of indications; its length \(C\), in seconds, is typically 60 to 120 seconds at urban intersections. The cycle is divided into phases, each serving a set of movements that can move together without conflict, such as all east-west through and right-turn movements. Each phase has a green interval, a yellow change interval and usually an all-red clearance interval. Left turns can be permitted (turning through gaps in opposing traffic), protected (with their own arrow while opposing traffic is stopped), or both in sequence.
Modern North American controllers use the ring-and-barrier structure defined by the National Electrical Manufacturers Association (NEMA), in which up to eight vehicle phases are arranged in two rings so that compatible movements overlap. Signals may be pre-timed, with a fixed cycle; actuated, with green times that respond to detectors; or adaptive, with timings that change continuously in response to measured demand. Even actuated signals rely on the same timing principles described here, because their maximum greens and coordination plans are designed from expected volumes.
Saturation flow and lost time
When a signal turns green, the first few vehicles in a queue take longer to start and cross than those behind them. After four or five vehicles, the queue discharges at a steady rate, the saturation flow rate \(s\), typically about 1,800 to 1,900 vehicles per hour of green per lane under base conditions, corresponding to a saturation headway of about 2 seconds. The time lost at the start of green, plus the unused part of the yellow and all-red at the end, is the lost time per phase, typically 3 to 5 seconds. The effective green \(g\) is the time during which the movement is effectively discharging at the saturation flow:
where \(G\) is the displayed green, \(Y\) the yellow, \(AR\) the all-red and \(t_L\) the lost time. The capacity of a lane group is the saturation flow multiplied by the fraction of the cycle that is effectively green:
The flow ratio \(y = v/s\) measures how much green a lane group needs as a fraction of the cycle, and the volume-to-capacity ratio \(X = v/c = yC/g\) measures how heavily it is loaded. In each phase, the lane group with the highest flow ratio, the critical lane group, determines how much green that phase needs.
Cycle length
A longer cycle reduces the share of time lost to start-up and clearance, increasing capacity, but it lengthens the red time that drivers and pedestrians wait. In the 1950s, F. V. Webster derived, from simulation and theory, a cycle length that approximately minimizes total delay at a pre-timed signal:
where \(L\) is the total lost time per cycle and \(Y = \sum y_{crit}\) the sum of the critical flow ratios. As \(Y\) approaches 1, the intersection approaches capacity and the optimum cycle grows rapidly. The minimum cycle that just serves the demand, at \(X = 1\) for all critical lane groups, is \(L/(1 - Y)\); a practical design aims for critical \(X\) of about 0.85 to 0.95. Once the cycle is chosen, the effective green is divided among phases in proportion to their critical flow ratios, which gives each critical lane group the same degree of saturation.
Delay and level of service
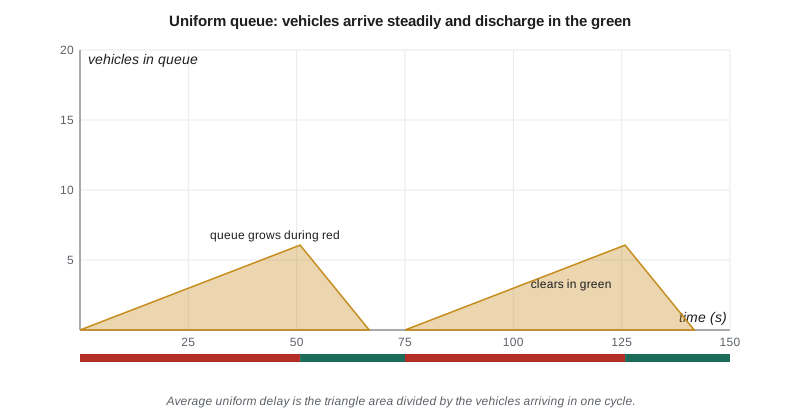
The level of service at a signal is based on control delay: the extra time a vehicle spends because of the signal, including slowing, stopping, waiting in the queue and accelerating. The HCM estimates average control delay as the sum of a uniform delay, which would occur if vehicles arrived evenly, an incremental delay, which accounts for random arrivals and overflow queues, and an initial queue delay, when a queue is left over from a previous period. The uniform delay, from Webster's work, is
and the incremental delay for an analysis period \(T\) (hours) is
where \(k\) is an adjustment for the controller type (0.5 for pre-timed) and \(I\) for upstream filtering (1.0 for an isolated intersection). The uniform delay is the area of the queue triangle in each cycle divided by the vehicles arriving; the incremental term grows rapidly as \(X\) approaches and exceeds 1.
| LOS | Control delay (s/veh) | Typical description |
|---|---|---|
| A | ≤ 10 | Most vehicles arrive on green; very little delay |
| B | > 10 to 20 | Good progression or short cycles |
| C | > 20 to 35 | Some vehicles stop; occasional cycle failures begin |
| D | > 35 to 55 | Many vehicles stop; congestion noticeable |
| E | > 55 to 80 | Frequent cycle failures; long queues |
| F | > 80 or v/c > 1 | Demand exceeds capacity; unacceptable to most drivers |
Change and clearance intervals
The yellow change interval warns drivers that the green is ending. It must be long enough that a driver too close to stop comfortably can proceed, and one far enough back can stop. The kinematic formula, recommended by the Institute of Transportation Engineers, is
with perception-reaction time \(t\) of 1 second, approach speed \(v\), comfortable deceleration \(a\) of about 3 m/s² (10 ft/s²) and grade \(G\). Typical yellow intervals are 3 to 6 seconds. The all-red interval lets a vehicle that entered at the end of yellow clear the intersection before conflicting traffic starts; it is commonly computed as \((W + L)/v\), where \(W\) is the width to be crossed and \(L\) the vehicle length. When the yellow is too short, drivers face a 'dilemma zone' in which they can neither stop comfortably nor clear in time, and red-light running increases.
Pedestrian timing
Pedestrians crossing with a phase need a walk interval, long enough to step off the curb, typically at least 7 seconds, and a pedestrian change interval (flashing DON'T WALK) long enough to cross the full width at 3.5 ft/s, with a countdown display. The MUTCD also requires that the walk plus the change interval be long enough to cross from the curb ramp at 3 ft/s, and a buffer interval of at least 3 seconds before conflicting traffic is released. If the pedestrian times do not fit in the green, yellow and all-red of the phase, either the phase is lengthened when a pedestrian pushes the button or the cycle is lengthened, which is exactly the problem at Carrick Street.
Leading pedestrian intervals, which start the walk a few seconds before the parallel vehicle green, let pedestrians establish themselves in the crosswalk before turning vehicles move, and are associated with fewer pedestrian collisions. Accessible pedestrian signals, with audible and vibrotactile indications, help people with visual impairments. Both are low-cost improvements that should be considered at every signal on a corridor with schools.
Retiming Ridgeway Road at Carrick Street
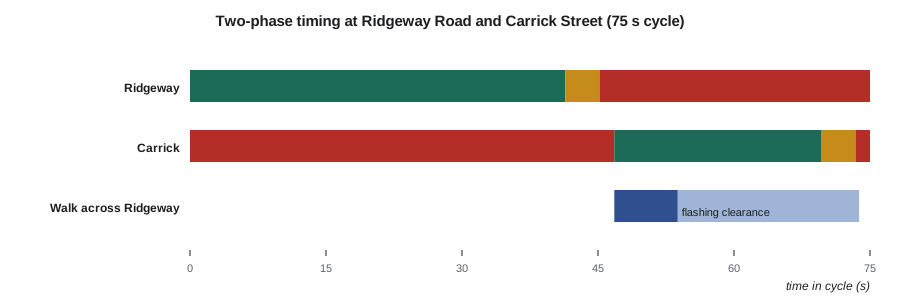
The signal at Ridgeway and Carrick runs two phases, east-west on Ridgeway and north-south on Carrick, with permitted left turns. Owen's design-year PM peak critical lane flows are 760 veh/h/ln on Ridgeway and 430 veh/h/ln on Carrick, with a saturation flow of 1,800 veh/h/ln and 4 seconds of lost time per phase. The approach speed on Ridgeway is 35 mph, the intersection is about 66 ft across, and pedestrians crossing Ridgeway walk about 70 ft. The script computes the Webster cycle, the change intervals and the pedestrian time, chooses a cycle that satisfies both vehicles and pedestrians, and estimates the delay and LOS of each phase.
# Signal timing at Ridgeway Road and Carrick Street (two phases)
import math
UNITS = "US"
SI = UNITS == "SI"
s = 1800                              # saturation flow, veh/h/ln of green
crit = {"Ridgeway (E-W)": 760, "Carrick (N-S)": 430}   # critical lane flows, veh/h/ln, design year
lost = 4.0                            # lost time per phase, s
L = lost * len(crit)
Y = sum(v / s for v in crit.values())
C0 = (1.5 * L + 5) / (1 - Y)
print(f"sum of critical flow ratios Y = {Y:.3f}, Webster optimum C0 = {C0:.1f} s")
# yellow change and red clearance (kinematic method), pedestrian time across Ridgeway
if SI:
    v = 60 / 3.6; t, a = 1.0, 3.0; W, Lv = 20.0, 6.0; walk, Xw = 1.0, 20.0; gg = 9.81
else:
    v = 35 * 1.467; t, a = 1.0, 10.0; W, Lv = 66.0, 20.0; walk, Xw = 3.5, 70.0; gg = 32.2
G = 0.0                               # approach grade
y_int = t + v / (2 * a + 2 * gg * G)
r_int = (W + Lv) / v
ped = 7 + Xw / walk
print(f"yellow = {y_int:.1f} s, all-red = {r_int:.1f} s, pedestrian walk + clearance = {ped:.0f} s")
# smallest 5-s cycle that is at least C0 and lets the Carrick phase hold the crossing
need = ped - lost                     # effective green the Carrick phase must have
C = 5 * math.ceil(C0 / 5)
while (C - L) * crit["Carrick (N-S)"] / s / Y < need:
    C += 5
print(f"cycle chosen = {C} s (vehicles alone would need {5*math.ceil(C0/5)} s)")
geff = C - L
for ph, vol in crit.items():
    y = vol / s; g = geff * y / Y; X = y * C / g; cap = s * g / C
    d1 = 0.5 * C * (1 - g / C) ** 2 / (1 - min(1, X) * g / C)
    T, k, I = 0.25, 0.5, 1.0
    d2 = 900 * T * ((X - 1) + math.sqrt((X - 1) ** 2 + 8 * k * I * X / (cap * T)))
    d = d1 + d2
    l = 'A' if d <= 10 else 'B' if d <= 20 else 'C' if d <= 35 else 'D' if d <= 55 else 'E' if d <= 80 else 'F'
    shown = g + lost - y_int - r_int
print(f"{ph:15s} effective g = {g:4.1f} s (displayed green {shown:4.1f} s) X = {X:.2f} capacity = {cap:4.0f} veh/h/ln delay = {d:4.1f} s/veh LOS {l}")sum of critical flow ratios Y = 0.661, Webster optimum C0 = 50.2 s yellow = 3.6 s, all-red = 1.7 s, pedestrian walk + clearance = 27 s cycle chosen = 75 s (vehicles alone would need 55 s) Ridgeway (E-W) effective g = 42.8 s (displayed green 41.5 s) X = 0.74 capacity = 1027 veh/h/ln delay = 16.8 s/veh LOS B Carrick (N-S) effective g = 24.2 s (displayed green 23.0 s) X = 0.74 capacity = 581 veh/h/ln delay = 30.8 s/veh LOS C
The sum of the critical flow ratios is 0.66, and the Webster cycle is about 50 seconds, or 55 seconds rounded up. But pedestrians need 27 seconds to cross Ridgeway, and with a 55-second cycle the Carrick phase would be far too short. The smallest cycle that serves both is 75 seconds. At that cycle, both critical lane groups run at a degree of saturation of 0.74; Ridgeway operates at LOS B with about 17 seconds of delay and Carrick at LOS C with about 31 seconds. The current signal runs a 60-second cycle with a split that favors Ridgeway more heavily, which explains both the Carrick queues and the students' complaints about the walk time.
Three further changes are recommended. Protected-permitted left turns on Ridgeway, using flashing yellow arrows, give left-turning drivers a protected arrow at the start of the Ridgeway phase while keeping the permitted turn later; lesson 11 shows the expected safety benefit. A leading pedestrian interval of 3 to 5 seconds is added to the Carrick phase for the school crossing. And the signal will be coordinated with the next signal west, so that eastbound platoons arrive on green.
Worked problem
Yellow and all-red on a downgrade
An approach has a speed of 45 mph on a 4 % downgrade, and the intersection is 80 ft wide. Use t = 1 s, a = 10 ft/s² and a vehicle length of 20 ft.
Show solution
- \[v = 45 \times 1.467 = 66.0\ \text{ft/s}\]
- \[Y = 1 + \frac{66.0}{2(10) + 2(32.2)(-0.04)} = 1 + \frac{66.0}{17.42} = 4.8\ \text{s}\]
- \[AR = \frac{80 + 20}{66.0} = 1.5\ \text{s}\]
Answer: A yellow of about 4.7 to 4.8 seconds followed by 1.5 seconds of all-red. The downgrade adds about half a second to the yellow.
Coordination and corridors
Signals spaced closely along a corridor work best when coordinated, with a common cycle length and offsets that let platoons travel through successive greens. The time-space diagram from lesson 3 is the tool: the bandwidth of green through the corridor depends on the spacing, the speed and the cycle. Coordination can greatly reduce stops and delay along the main street, at some cost to the side streets. On Ridgeway, the 75-second cycle needed at Carrick Street becomes the corridor's coordination cycle, and the progression speed is set at the posted limit, which also discourages speeding: drivers who exceed it arrive early and stop.
Common mistakes
MistakeUsing the hourly volume instead of the peak 15-minute rate.
InsteadDivide volumes by the PHF before computing flow ratios.
MistakeChoosing the cycle for vehicles only.
InsteadCheck that the walk and clearance fit in the parallel phase; pedestrian needs often set the cycle.
MistakeUsing the displayed green as the effective green.
InsteadEffective green is displayed green plus yellow and all-red minus the lost time.
MistakeSetting yellow intervals by habit.
InsteadCompute them from approach speed and grade with the kinematic formula.
Summary and key terms
- Capacity of a lane group is \(c = s\,g/C\); the degree of saturation is \(X = v/c\).
- Webster's cycle \(C_0 = (1.5L + 5)/(1 - Y)\) approximately minimizes delay; green is split in proportion to critical flow ratios.
- Control delay is uniform plus incremental (plus initial queue) delay; LOS ranges from A (≤ 10 s) to F (> 80 s).
- Yellow is \(t + v/(2a + 2gG)\); all-red clears the intersection width plus a vehicle length.
- Pedestrian walk and clearance times can control the cycle length; leading pedestrian intervals improve safety.
- Cycle length
- The time for one complete sequence of signal indications.
- Phase
- The part of a cycle serving a set of non-conflicting movements.
- Saturation flow rate
- The steady discharge rate of a queue during green, per lane.
- Lost time
- The part of a phase not used effectively, at start-up and at the end of the change interval.
- Effective green
- The time during which a movement effectively discharges at the saturation flow.
- Control delay
- The delay caused by a traffic control device, used for intersection LOS.
- Leading pedestrian interval
- A walk indication that starts a few seconds before the parallel vehicle green.
Practice problems
Work each problem on paper first, then reveal the answer to check.
Critical flow ratios are 0.35, 0.25 and 0.15, with 4 s lost per phase. Find Webster's cycle.
Show answer
\(L = 12\), \(Y = 0.75\); \(C_0 = (18 + 5)/0.25 = 92\) s.
A lane group has s = 1,800 veh/h, g = 30 s and C = 80 s. Find the capacity and X for v = 600 veh/h.
Show answer
\(c = 1800 \times 30/80 = 675\) veh/h; \(X = 600/675 = 0.89\).
Find the uniform delay for C = 80 s, g = 30 s and X = 0.89.
Show answer
\(d_1 = 0.5(80)(0.625)^2/(1 - 0.89 \times 0.375) = 15.6/0.666 = 23.5\) s.
Find the yellow interval for 30 mph on level ground (t = 1 s, a = 10 ft/s²).
Show answer
\(1 + 44.0/20 = 3.2\) s.
Lesson quiz · 5 questions
Score 60% or more to complete this lesson.
Create a free account to save your progress, take quizzes and earn a certificate.