
CIV-390 · Lesson 1 of 12 · 21 min
Transportation systems and the role of the engineer
Every morning in Duluth, thousands of people leave home for work, school, appointments and errands. Trucks bring groceries to the stores along Ridgeway Road, buses carry students to the college, snowplows leave the city's operations center before dawn, and a few hardy cyclists ride to work even in February. None of them think much about the road network that makes this possible, until something goes wrong: a signal that holds them too long, a left turn they cannot make, a curve that catches them on black ice. Transportation engineering is the discipline that plans, designs and operates the facilities that carry people and goods, and it is judged every day by people who never see the engineer's work. This course follows Kestrel Bay Engineering as it carries out a corridor study for the City of Duluth on Ridgeway Road, the arterial that leads to the city's new municipal operations center.
The team is familiar from the earlier civil courses. Priya Raman, the project lead, has designed the operations center's buildings and site drainage; Owen Lachance, now an engineer in training, will carry most of the traffic analysis; and Sofia Martel, the co-op student, writes the Python scripts that check every hand calculation. Ridgeway Road is an invented street, but its problems are typical of a mid-sized northern city: a four-lane undivided arterial built in the 1970s, a busy signalized intersection at Carrick Street, a new traffic generator at the east end, a two-lane rural extension with a sharp curve and a crest over a rail spur, and a growing number of residents who want to walk and cycle safely.
What transportation engineers do
Transportation engineering spans a wide range of work. Planners forecast how much travel there will be and where, and evaluate alternatives such as new roads, transit service or land-use changes. Traffic engineers measure and analyze traffic, time signals, choose traffic control devices and manage operations. Geometric designers lay out the horizontal and vertical alignment and cross-section of roads and intersections. Safety engineers study crash patterns and select countermeasures. Pavement engineers design the layers that carry the loads, a topic covered in its own course. Increasingly, transportation engineers also work on transit, active transportation, freight, data systems and the effects of new technology such as connected and automated vehicles.
The common thread is that transportation facilities serve people with different needs and abilities. A design that moves cars quickly may make a street dangerous to cross on foot; a design that slows traffic may lengthen bus trips and delay emergency vehicles. Good transportation engineering makes these trade-offs explicit, quantifies them where it can, and presents them honestly to the people who decide. That is why this course mixes physics (how far a vehicle needs to stop), statistics (how variable traffic and crashes are), operations analysis (how much delay a signal causes) and planning (how travel responds to change).
The road network and functional classification
Roads are classified by function, according to the balance they strike between mobility, the ability to move through traffic efficiently over longer distances, and access, the ability to reach adjacent land. Freeways provide high mobility with no direct access: entry and exit are only at interchanges. Arterials carry large volumes between parts of a city and connect to the freeway system, with some access to adjacent land. Collectors gather traffic from neighborhoods and deliver it to arterials. Local streets provide direct access to homes and businesses and are not meant to carry through traffic.
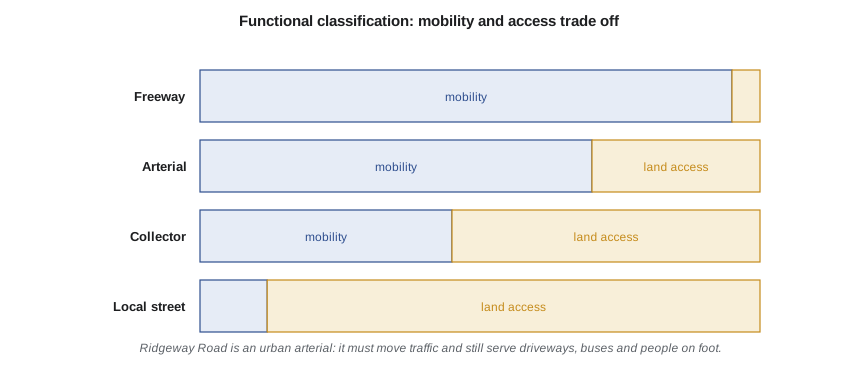
The Federal Highway Administration (FHWA) defines functional classes for federal funding and reporting, and AASHTO's A Policy on Geometric Design of Highways and Streets, known as the Green Book, links design criteria to them. The 2018 seventh edition of the Green Book introduced a context classification (rural, rural town, suburban, urban and urban core) alongside the functional class, so that a design reflects where a road is as well as what it does. Classification matters because it sets the design speed, the access spacing, the lane widths and the expectations of drivers. A road that functions as an arterial but has driveways every 100 ft behaves differently from one with controlled access, and a local street that becomes a shortcut for through traffic causes complaints and crashes.
Ridgeway Road is classified as an urban minor arterial in its western section, where it passes shops, a high school and several apartment buildings, and as a rural collector in its eastern extension past the operations site. The study must respect both roles: it cannot turn the western section into a high-speed through route without making it hostile to the people who live and shop there, and it cannot ignore the trucks and plows that will use the eastern section every day.
Standards, guides and the engineer's judgment
American transportation engineering relies on a set of national documents adopted by each state. AASHTO's Green Book covers alignment and cross-section; the Manual on Uniform Traffic Control Devices (MUTCD), whose eleventh edition took effect in January 2024, is the national standard for signs, signals and markings, and states had until January 2026 to adopt it or a state manual in substantial conformance. Minnesota publishes its own state MUTCD and a road design manual for state routes. Capacity analysis uses the Highway Capacity Manual (HCM), now in its seventh edition, and safety analysis uses AASHTO's Highway Safety Manual (HSM), with a second edition in development. Cities such as Duluth apply these documents to municipal streets, often adding their own street design guidance.
These documents use careful language. A standard or a 'shall' statement is mandatory; guidance or 'should' is recommended practice that an engineer may depart from with good reason; an option or 'may' is permissive. Design guides increasingly present ranges rather than single values and ask the designer to choose within them for the context. This flexibility is deliberate: a guide written for every road in a country cannot anticipate every site. It also places responsibility on the engineer to document why a choice was made, especially when a value below the usual minimum is used. Throughout this course, numerical values from guides are given as typical values for learning; on a real project, the engineer works from the current edition adopted by the road authority.
The scale of the system
Americans drive more than three trillion vehicle-miles a year, and transportation is the largest source of greenhouse gas emissions in the United States. Roads are also where most transportation deaths occur: in recent years, roughly 40,000 people a year have died in motor vehicle crashes in the United States. These two facts frame much of modern practice. Engineers are asked to accommodate travel, but also to reduce its harms, through safer designs, better transit and walking and cycling networks, and land use that shortens trips.
A single corridor is a small part of that system, but the same questions arise at every scale. How much travel will there be? Can the facility carry it at an acceptable level of delay? Is it safe for everyone who uses it? What does it cost, and who benefits? The Ridgeway Road study will answer each of these questions in turn, and lesson 12 will pull the answers together into a set of recommendations.
Measuring traffic demand
Traffic volume is described at several time scales. The annual average daily traffic (AADT) is the total volume over a year divided by 365; it is the basic measure for planning, safety analysis and pavement design. Within a day, traffic peaks in the morning and afternoon. Design is based on an hour, not a day, because a road that carries its daily total comfortably can still be overloaded in the peak hour. The design hourly volume (DHV) is usually taken as the 30th highest hourly volume of the year on rural roads, or a typical weekday peak hour in urban areas, and is related to the AADT by the K factor:
where \(D\) is the share of the peak-hour volume traveling in the heavier direction. Typical K factors range from about 0.08 to 0.12 for urban roads and higher for recreational routes; typical D factors are 0.55 to 0.65. Because traffic grows over the life of a facility, design uses a forecast volume for a design year, commonly 20 years after opening. A simple forecast applies a compound growth rate to today's count and adds the traffic from known new developments:
This is a crude forecast, and lesson 12 will introduce the travel demand models that planners use to do better. But even a simple forecast carries a lesson: small differences in assumed growth compound into large differences in design volume over 20 years. Sensitivity checks are part of every good forecast.
Design-year volumes for Ridgeway Road
The city's 2026 count program measured an AADT of 18,500 vehicles per day on the western section of Ridgeway Road, with about 6 % heavy vehicles. The metropolitan planning organization's long-range plan assumes background growth of 1.5 % per year, and Kestrel Bay's traffic impact study for the operations center estimated 1,400 new daily trips, including staff, visitors, fleet vehicles and trucks. Owen uses a K factor of 0.10 and a directional split of 0.55 from a permanent count station on a similar arterial.
# Design-year traffic for the Ridgeway Road corridor
UNITS = "US"
SI = UNITS == "SI"
aadt_now = 18500          # veh/d, two-way, from the 2026 count program
growth = 0.015            # background growth per year (compound)
years = 20                # design horizon
site = 1400               # new daily trips from the operations site (two-way)
K, D = 0.10, 0.55         # design hour factor and directional split
truck_share = 0.06        # heavy vehicles on the corridor
aadt_design = aadt_now * (1 + growth) ** years + site
dhv = aadt_design * K
ddhv = dhv * D
print(f"design-year AADT  = {aadt_design:,.0f} veh/d")
print(f"design hour (two-way) = {dhv:,.0f} veh/h")
print(f"peak direction   = {ddhv:,.0f} veh/h ({ddhv*truck_share:,.0f} heavy vehicles)")
# how sensitive is the answer to the growth assumption?
for g in (0.005, 0.010, 0.015, 0.020):
    a = aadt_now * (1 + g) ** years + site
    print(f"growth {g*100:.1f} %/yr -> AADT {a:,.0f}, peak direction {a*K*D:,.0f} veh/h")
# annual vehicle travel on the 2.8 km / 1.75 mi corridor today
L = 2.8 if SI else 1.75
vkt = aadt_now * L * 365
print(f"annual travel today = {vkt/1e6:,.1f} million {'veh-km' if SI else 'veh-mi'}")design-year AADT = 26,317 veh/d design hour (two-way) = 2,632 veh/h peak direction = 1,447 veh/h (87 heavy vehicles) growth 0.5 %/yr -> AADT 21,841, peak direction 1,201 veh/h growth 1.0 %/yr -> AADT 23,974, peak direction 1,319 veh/h growth 1.5 %/yr -> AADT 26,317, peak direction 1,447 veh/h growth 2.0 %/yr -> AADT 28,890, peak direction 1,589 veh/h annual travel today = 11.8 million veh-mi
The forecast design-year AADT is about 26,300 vehicles per day, giving a peak-direction design hourly volume of about 1,450 vehicles per hour. If growth were 1.0 % per year instead of 1.5 %, the peak-direction volume would be about 1,320 vehicles per hour, roughly 9 % lower; at 2.0 % it would be about 1,590. Priya asks Owen to carry the 1.5 % forecast as the base case and to test the key decisions against the high and low values. The decisions that depend most on this number, such as whether Ridgeway can lose a through lane in each direction, will be revisited in lessons 10 and 12.
Worked problem
Design hourly volume
A suburban arterial has an AADT of 22,000 veh/d, a K factor of 0.09 and a directional split of 0.60. Find the directional design hourly volume and the number of lanes needed in the peak direction if each lane can serve about 800 veh/h at the signals.
Show solution
- \[DDHV = 0.60 \times 0.09 \times 22\,000 = 1\,188\ \text{veh/h}\]
- \[\text{lanes} = 1\,188 / 800 = 1.49 \;\Rightarrow\; 2\ \text{lanes}\]
Answer: Two through lanes in each direction are needed. The 800 veh/h per lane is a rough planning value; lesson 6 shows how signal timing sets the real capacity.
Who decides, and how engineers contribute
In the United States, local streets are owned and operated by cities and counties, state highways by state departments of transportation, and interstate highways by the states with federal funding and oversight. Projects that use federal funds must comply with the National Environmental Policy Act (NEPA), which requires the agency to identify the purpose and need, evaluate alternatives, consider environmental effects and involve the public. The engineer's role is to provide sound technical analysis and to present it clearly; the city council or the agency makes the decision. Professional engineers in Minnesota are licensed by the state board, and a traffic study or design submitted to a road authority is signed by a licensed engineer who takes responsibility for it.
Public involvement is not a formality. Residents know where the near misses happen, which intersections they avoid and which streets they would walk if they felt safe. In the Ridgeway study, the team holds an open house and runs an online survey before analyzing any alternatives. Two themes dominate the comments: drivers complain about the left turn out of the plaza near Carrick Street, and parents worry about students crossing Ridgeway to reach the high school. Both concerns will reappear, as numbers, in later lessons.
| Lesson | Question for Ridgeway Road | Main tools |
|---|---|---|
| 2 | How much sight distance do drivers need? | Perception-reaction time, braking |
| 3 and 4 | How does traffic behave, and what do the counts show? | Flow, speed and density; field studies |
| 5 | Will the bypass freeway cope with diverted traffic? | HCM basic segment analysis |
| 6 and 7 | How should the intersections be controlled? | Signal timing, gap acceptance, roundabouts |
| 8 and 9 | Is the rural extension safe for its design speed? | Horizontal and vertical alignment |
| 10 and 11 | Can the street be safer for everyone? | Cross-sections, road diets, safety analysis |
| 12 | What should the city build? | Travel demand models and evaluation |
Common mistakes
MistakeDesigning for daily traffic instead of the peak hour.
InsteadCapacity problems occur in the peak hour; design uses the design hourly volume, not AADT.
MistakeTreating a forecast as a fact.
InsteadTest decisions against a range of growth rates and report how sensitive they are.
MistakeApplying a guide value without considering context.
InsteadGuides give ranges; choose and document values that suit the road's function, users and setting.
Summary and key terms
- Transportation engineering plans, designs and operates facilities for people and goods, balancing mobility, access, safety, cost and community.
- Functional classification describes the balance between mobility and access and drives design criteria.
- National guides set the framework; road authorities adopt them and engineers apply them with documented judgment.
- AADT measures annual demand; design uses the design hourly volume, \(DHV = K \times AADT\), split by direction.
- Forecasts compound growth rates over the design life, so sensitivity tests are essential.
- Functional classification
- The grouping of roads by the balance they strike between mobility and land access.
- Annual average daily traffic
- The total yearly volume at a point divided by 365.
- Design hourly volume
- The hourly volume used for design, usually a high hour of the design year.
- K factor
- The ratio of the design hourly volume to the AADT.
- Directional split
- The share of peak-hour traffic traveling in the heavier direction.
- Design year
- The future year, often 20 years after opening, for which a facility is designed.
- Context classification
- A description of a road's surroundings, such as rural, suburban or urban, used alongside its function to select design values.
Practice problems
Work each problem on paper first, then reveal the answer to check.
An urban arterial has AADT 15,000 veh/d, K = 0.10 and D = 0.58. Find the DDHV.
Show answer
\(0.58 \times 0.10 \times 15\,000 = 870\) veh/h.
Today's AADT of 12,000 grows at 2 % per year. What is it in 20 years?
Show answer
\(12\,000 \times 1.02^{20} = 17\,830\) veh/d.
Why might a local street carrying 6,000 veh/d be a problem even if it has spare capacity?
Show answer
It is carrying through traffic it was not designed for, which conflicts with its access function, raises speeds and exposes residents to risk.
A guide gives a lane width range of 3.0 to 3.7 m (10 to 12 ft) for urban arterials. What factors would push a choice toward the low end?
Show answer
Lower speeds, high pedestrian activity, the need for space for bike lanes or sidewalks, and few large vehicles.
Lesson quiz · 5 questions
Score 60% or more to complete this lesson.
Create a free account to save your progress, take quizzes and earn a certificate.