
CIV-370 · Lesson 11 of 12 · 19 min
Flood frequency analysis and climate change
Lesson 10 estimated the 100-year flood of Kestrel Creek by building it from a design storm. That approach assumes that a 100-year storm produces a 100-year flood, which is only roughly true: the flood also depends on how wet the watershed is, on snowmelt and on the storm's pattern. Where streamflow has been measured for many years, the flood can instead be estimated directly from the record by statistical analysis. This lesson applies flood frequency analysis to a regional gauge, transfers the result to the ungauged creek, compares it with the hydrograph estimate, and then asks how a changing climate affects a design that must serve for decades.
Streamflow records
In the United States, the US Geological Survey operates the national network of streamgages, many in cooperation with state and local agencies, and publishes the data through its National Water Information System. Each gage measures water level continuously and converts it to discharge through a rating curve, built from periodic measurements of flow, as described in lesson 6. Many small streams, including Kestrel Creek, have no gage, but a gaged creek of similar character nearby can serve as a model, and the USGS StreamStats application provides regional regression estimates for ungaged sites.
For flood analysis, the largest instantaneous peak flow in each water year forms the annual maximum series, just as for rainfall in lesson 7. A partial duration series, which includes every peak above a threshold, is sometimes used for frequent floods. The record must be checked for homogeneity: changes in the watershed, such as urbanization, dams or drainage works, and changes in the gauge or its rating can make early and late years incomparable.
Plotting positions
Before fitting a distribution, the recorded peaks are ranked from largest to smallest and plotted against an empirical estimate of their return period. The Weibull plotting position assigns the \(m\)th largest of \(n\) values a return period
Other formulas, such as Cunnane's, \(T = (n + 0.2)/(m - 0.4)\), are less biased for particular distributions. Plotting the data on probability paper, where a chosen distribution appears as a straight line, shows at a glance how well the distribution fits and whether any points are outliers.
Distributions and the frequency factor
Many distributions have been used for floods. Chow showed in 1951 that most can be written in the same frequency factor form as the Gumbel distribution of lesson 7:
where \(K_T\) depends on the distribution, the return period and, for three-parameter distributions, the skew. The Gumbel distribution has a fixed skew of 1.14. The log-Pearson type III (LP3) distribution applies the Pearson type III distribution to the logarithms of the flows, with three parameters: the mean, standard deviation and skew coefficient of the logs. Its frequency factor is tabulated against skew and return period, or approximated by the Wilson-Hilferty transformation:
where \(G\) is the skew coefficient and \(z\) the standard normal variate for the non-exceedance probability \(1 - 1/T\). When \(G = 0\), the LP3 distribution becomes the log-normal distribution and \(K_T = z\).
In the United States, federal agencies follow Bulletin 17C, Guidelines for Determining Flood Flow Frequency, published by the US Geological Survey in 2018 and revised in 2019. It specifies the log-Pearson type III distribution fitted by the expected moments algorithm, which can incorporate historical floods and censored data, a multiple Grubbs-Beck test to identify low outliers that distort the fit, and weighting of the station skew with a regional skew to reduce the large sampling error of skew from short records.
Uncertainty
A 40-year record gives a reasonable estimate of the 10-year flood and a much less certain estimate of the 100-year flood, which lies beyond the range of the data. Confidence intervals widen rapidly with return period. The skew coefficient in particular is poorly determined from short records, which is why regional skews are used. A single extreme flood in a short record can change the estimate substantially, as can the choice of distribution. Engineers should report the uncertainty and, for important structures, check a range of estimates rather than a single number.
Transferring to an ungauged site
Flows estimated at a gauge are transferred to an ungauged site on a similar stream by an area ratio:
where the exponent \(b\) is commonly between 0.5 and 1, and about 0.7 to 0.8 for flood peaks in many regions; smaller watersheds produce more flow per unit area because storms cover them completely and their response is quicker. Regional regression equations, which relate flood quantiles to drainage area, slope, storage and climate across many gauges, are a more refined method. The transfer is reliable only when the two watersheds are similar in climate, soils, slope and storage, and the area ratio is not extreme.
The regional gauge
About 12 miles from the site, a gaged creek with a watershed of 18.5 mi² drains similar forest and pasture over the same glacial lake deposits. Anika obtains its 40-year record of annual peaks. For this course the record is illustrative, generated for teaching rather than taken from an actual station.
Worked problem
The 100-year flood at the gauge by log-Pearson III
The logarithms (base 10) of the 40 annual peaks in cfs have a mean of 3.0349, a standard deviation of 0.1553 and a skew of 0.462. Find the 100-year flood.
Show solution
- Standard normal variate for \(1 - 1/100 = 0.99\): \(z = 2.326\). With \(G/6 = 0.0770\):
- \[K_{100} = \frac{2}{0.462}\Big[\big(1 + 0.0770(2.326) - 0.0770^2\big)^3 - 1\Big] = 4.329\big(1.1732^3 - 1\big) = 2.661\]
- \[\log Q_{100} = 3.0349 + 2.661(0.1553) = 3.4482 \qquad Q_{100} = 2{,}810\ \text{cfs}\]
Answer: The positive skew lifts the 100-year estimate above the log-normal value, for which \(K = z = 2.326\) would give about 2,490 cfs.
Sofia's script computes the statistics, the plotting positions of the largest floods, the Gumbel and LP3 quantiles, the transfer to Kestrel Creek and the effect of an increase in storm rainfall on runoff.
# Flood frequency analysis of a regional gauge and transfer to Kestrel Creek
from math import log10, sqrt, log, pi, exp
UNITS = "US"
SI = UNITS == "SI"
cf = 1.0 if SI else 35.315; uq = "m3/s" if SI else "cfs"
# Illustrative 40-year annual peak series at a gauge on a nearby creek, 48 km2 (m3/s)
peaks = [31.2, 22.8, 45.6, 18.9, 27.4, 38.1, 24.5, 52.3, 20.1, 29.8, 34.7, 16.4, 41.9, 26.3, 23.7, 61.8,
         28.5, 19.6, 33.2, 47.4, 25.1, 21.9, 36.6, 30.4, 17.8, 43.3, 27.9, 24.0, 56.7, 32.5, 22.1, 39.4,
         26.8, 20.7, 35.3, 29.1, 48.9, 23.3, 31.7, 72.4]
x = [p * cf for p in peaks]; n = len(x)
mean = sum(x) / n; sd = sqrt(sum((v - mean) ** 2 for v in x) / (n - 1))
def KG(T): return -sqrt(6) / pi * (0.5772 + log(log(T / (T - 1))))
def z(p):                                      # standard normal quantile (Abramowitz and Stegun 26.2.23)
    q = p if p < 0.5 else 1 - p
    t = sqrt(-2 * log(q))
    zz = t - (2.515517 + 0.802853 * t + 0.010328 * t * t) / (1 + 1.432788 * t + 0.189269 * t * t + 0.001308 * t ** 3)
    return -zz if p < 0.5 else zz
y = [log10(v) for v in x]
my = sum(y) / n; sy = sqrt(sum((v - my) ** 2 for v in y) / (n - 1))
G = n * sum((v - my) ** 3 for v in y) / ((n - 1) * (n - 2) * sy ** 3)
def KP(T, g):                                  # Wilson-Hilferty frequency factor for Pearson type III
    zz = z(1 - 1 / T); k = g / 6
    return zz if abs(g) < 1e-6 else (2 / g) * ((1 + k * zz - k * k) ** 3 - 1)
print(f"Gauge: n = {n}, mean {mean:.{1 if SI else 0}f} {uq}, sd {sd:.{1 if SI else 0}f}; logs: mean {my:.4f}, sd {sy:.4f}, skew {G:.3f}")
srt = sorted(x, reverse=True)
print("Largest three, Weibull return periods:", ", ".join(f"{v:.{1 if SI else 0}f} ({(n + 1) / (m + 1):.0f} yr)" for m, v in enumerate(srt[:3])))
print(f"{'T':>4} {'Gumbel':>8} {'LP3':>8}")
for T in (2, 10, 25, 50, 100, 200):
    print(f"{T:4d} {mean + KG(T) * sd:8.{1 if SI else 0}f} {10 ** (my + KP(T, G) * sy):8.{1 if SI else 0}f}")
Q100 = 10 ** (my + KP(100, G) * sy)
Ag, As = (48.0, 6.4) if SI else (18.5, 2.5)     # drainage areas, km2 or mi2 (gauge, Kestrel Creek)
r = (As / Ag) ** 0.75
print(f"\nTransfer to Kestrel Creek by (A/Ag)^0.75 = {r:.3f}: Q100 = {Q100 * r:.{1 if SI else 0}f} {uq}")
print(f"Unit hydrograph estimate (lesson 10): {17.8 if SI else 638} {uq}")
# climate change: rainfall +15 % and its effect on runoff depth with CN 75
def runoff(P, CN):
    S = 25400 / CN - 254; Ia = 0.2 * S
    return 0.0 if P <= Ia else (P - Ia) ** 2 / (P - Ia + S)
P = 71.5
for inc in (0.0, 0.10, 0.15, 0.20):
    q = runoff(P * (1 + inc), 75)
print(f"rain +{inc * 100:3.0f} %: runoff {q / (1 if SI else 25.4):.{1 if SI else 2}f} {'mm' if SI else 'in.'}, change {q / runoff(P, 75) * 100 - 100:+.0f} %")Gauge: n = 40, mean 1157 cfs, sd 451; logs: mean 3.0349, sd 0.1553, skew 0.462 Largest three, Weibull return periods: 2557 (41 yr), 2182 (20 yr), 2002 (14 yr) T Gumbel LP3 2 1083 1054 10 1744 1737 25 2078 2137 50 2325 2461 100 2570 2808 200 2814 3181 Transfer to Kestrel Creek by (A/Ag)^0.75 = 0.223: Q100 = 626 cfs Unit hydrograph estimate (lesson 10): 638 cfs rain + 0 %: runoff 0.84 in., change +0 % rain + 10 %: runoff 1.02 in., change +22 % rain + 15 %: runoff 1.12 in., change +33 % rain + 20 %: runoff 1.22 in., change +44 %
Reading the results
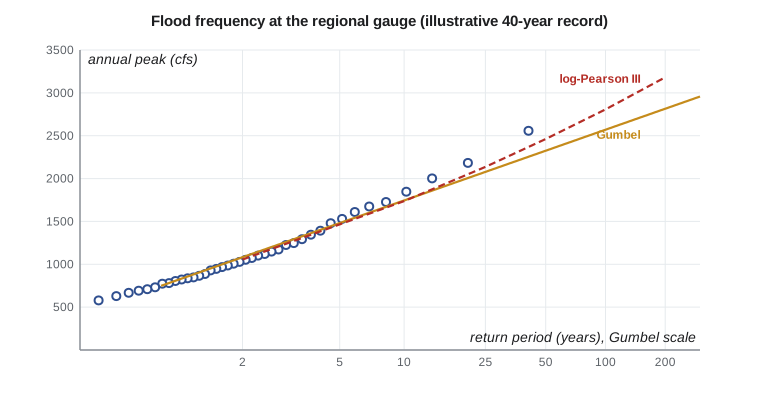
The two distributions agree closely up to about the 10-year flood, near 1,740 cfs, and diverge above it: at 100 years, Gumbel gives 2,570 cfs and LP3 gives 2,810 cfs. The largest recorded flood, 2,560 cfs, has a Weibull return period of 41 years; the LP3 curve passes closer to the largest floods, which is one reason to prefer it here. Transferring the LP3 value to Kestrel Creek with an exponent of 0.75 gives 626 cfs, close to the 638 cfs from the unit hydrograph. Two independent methods agree within 2 %, and Anika adopts 640 cfs as the 100-year design flow. Such close agreement is partly luck; differences of 20 to 30 % between methods are common, and the engineer must then judge which is more reliable.
Nonstationarity and climate change
Every method in this course so far assumes stationarity: that the statistics of rainfall and floods in the future will be the same as in the past record. That assumption is now in doubt. A warmer atmosphere holds more water vapor, about 7 % more per degree Celsius according to the Clausius-Clapeyron relation, and observations and climate models indicate that the heaviest short-duration rainfalls are intensifying in many regions, including the Great Lakes basin. Snowmelt floods may decline in some places as winters warm, while rain-on-snow events and winter rain on frozen ground may increase. Land-use change, especially urbanization, adds its own trend.
US practice is moving to account for this. NOAA Atlas 15 is being developed specifically to provide precipitation frequency estimates that include future climate projections, the Federal Highway Administration's guidance on highways in the coastal and riverine environment addresses climate change in hydraulic design, and some states and cities now require designers to check infrastructure with climate-adjusted rainfall or apply an uplift to design intensities. Until such requirements apply, engineers use sensitivity checks to understand how much margin a design has.
A practical approach for a project like Kestrel Bay is a sensitivity check: increase the design rainfall by a plausible amount, recompute the runoff and the flood, and see whether the design still performs or fails gracefully. The script shows why this matters: because runoff is a nonlinear function of rainfall, a 15 % increase in storm rainfall increases the runoff depth by 33 %, and the peak flow by a similar proportion. Anika therefore adds a climate check to the culvert design: a flow of 24 m³/s, about one-third above the 100-year flow. Lesson 12 tests both culverts against it.
Practical points
- Check the record for homogeneity and outliers before fitting.
- Follow the jurisdiction's method: Bulletin 17C in US federal work, or the provincial guidance in Canada.
- Compare a statistical estimate with a rainfall-runoff estimate; investigate large differences.
- Transfer flows only between similar watersheds, with a justified exponent.
- Report uncertainty and test sensitivity to climate change for long-lived infrastructure.
Common mistakes
MistakeExtrapolating a 15-year record to the 500-year flood with confidence.
InsteadUncertainty grows rapidly beyond the record length; use regional information and report confidence limits.
MistakeIncluding floods before and after major urbanization in one series without adjustment.
InsteadA changed watershed makes the record nonhomogeneous.
MistakeTransferring flows from a large regulated river to a small creek.
InsteadUse a gauge on a similar, unregulated watershed.
MistakeAssuming a 15 % increase in rainfall gives a 15 % increase in runoff.
InsteadRunoff responds nonlinearly; recompute it.
Summary and key terms
- Flood frequency analysis fits a distribution to the annual maximum series of peak flows.
- Weibull plotting position: \(T = (n + 1)/m\).
- Frequency factor form: \(x_T = \bar{x} + K_T s\); LP3 applies Pearson III to the logs with a skew-dependent \(K_T\).
- US: Bulletin 17C, LP3 by expected moments with regional skew. Canada: several distributions compared.
- Gage Q100: Gumbel 2,570, LP3 2,810 cfs; transferred 626 cfs vs 638 cfs by unit hydrograph; adopt 640 cfs.
- Climate change challenges stationarity; a 15 % rainfall increase raises runoff by about a third.
- Flood frequency analysis
- Statistical estimation of flood magnitudes for given return periods from recorded flows.
- Annual maximum series
- The largest peak flow in each year of record.
- Plotting position
- An empirical estimate of the return period of a ranked observation.
- Log-Pearson type III
- A three-parameter distribution of the logarithms of flows, used widely for floods.
- Skew coefficient
- A measure of the asymmetry of a distribution.
- Regional skew
- A skew coefficient estimated from many stations in a region, used to stabilize station estimates.
- Stationarity
- The assumption that the statistical properties of a process do not change with time.
- Sensitivity check
- A repeat of a design calculation with changed inputs to test the robustness of the result.
Practice problems
Work each problem on paper first, then reveal the answer to check.
In a 30-year record, what return period does the Weibull formula assign to the third largest flood?
Show answer
\(T = 31/3 = 10.3\) years.
A gage with 46 mi² of watershed has a 50-year flood of 4,900 cfs. Estimate the 50-year flood at a similar site with 11.5 mi² using an exponent of 0.75.
Show answer
\(4900(11.5/46)^{0.75} = 4900(0.354) = 1{,}730\) cfs.
For a log-normal distribution (zero skew), what is the frequency factor for the 100-year flood?
Show answer
\(K = z = 2.326\).
Why is the runoff increase larger, in percentage terms, than the rainfall increase in the climate check?
Show answer
The curve number relation is convex: once the initial abstraction is satisfied, each additional unit of rain produces more runoff than the average unit.
Lesson quiz · 5 questions
Score 60% or more to complete this lesson.
Create a free account to save your progress, take quizzes and earn a certificate.