
BUS-220 · Lesson 3 of 12 · 35 min
Marketing research and data
Good marketing decisions rest on good information about customers, competitors and markets. Should a café add a drive-through? Which of three package designs will stand out on the shelf? Is a new subscription price too high? How many people might buy an electric cargo bike in a given city? Marketing research is the systematic design, collection, analysis and reporting of data relevant to a specific marketing situation. This lesson covers the research process, the main sources and methods, sampling and survey design, digital analytics and experiments, market sizing, and the ethical and privacy rules that govern the use of customer data. Statistics in depth belong in STAT courses; here the aim is to make you an intelligent user and commissioner of research.
The research process
Research projects follow a broadly similar sequence. The first and most important step is defining the problem and research objectives. A vague brief such as 'find out why sales are down' leads to vague research. A good problem definition separates the management decision (should we reformulate the product, cut the price or change the advertising?) from the research questions that would inform it (has the product's perceived quality fallen relative to competitors? are lapsed customers buying a cheaper substitute?).
Research objectives fall into three broad types. Exploratory research gathers preliminary information to help define problems and suggest hypotheses; it often uses interviews, focus groups and reviews of existing data. Descriptive research describes things, such as the market potential for a product or the demographics and attitudes of customers, usually through surveys or analysis of transaction data. Causal research tests hypotheses about cause-and-effect relationships, such as whether a 10 % price cut will raise sales enough to increase profit, usually through experiments.
Next comes the research plan: what information is needed, where it will come from, which methods will be used, how participants will be sampled, how the data will be analyzed and what it will cost. The plan is followed by data collection, analysis and interpretation, and finally reporting the findings in a way that helps managers decide. A report that presents a mass of tables without a clear recommendation has failed its purpose.
Secondary data
Secondary data is information that already exists, having been collected for another purpose. It is usually quicker and cheaper to obtain than new data, and it should always be checked first. Internal secondary data includes sales records, customer databases, website and app analytics, call-center logs and loyalty-card data. External secondary data includes government statistics, industry association reports, published studies, news and syndicated research sold by specialist firms.
The US Census Bureau is the most important public source for American marketers. The decennial census counts the population, while the American Community Survey provides annual estimates of income, education, housing, language and commuting down to small areas. Monthly and quarterly reports cover retail sales and e-commerce, and the Bureau of Labor Statistics publishes consumer prices, consumer expenditure surveys and employment data. Industry groups such as the National Retail Federation add further detail.
Secondary data must be evaluated before use. Is it relevant to the question? Is it current, or has the market changed since it was collected? Is it accurate and impartial, or was it published by a group with an interest in a particular conclusion? Are definitions consistent? For example, Canadian and US statistics on e-commerce's share of retail sales are not directly comparable, because the two agencies define and measure online retail differently; a naive comparison would suggest a much larger gap between the countries than really exists.
Primary data and research approaches
When secondary data is not enough, the firm collects primary data for the specific purpose at hand. The main approaches are observation, surveys, experiments and qualitative methods such as interviews and focus groups.
Observational research gathers data by watching people, actions and situations. A retailer might track how shoppers move through a store, or a researcher might watch how people use a product in their kitchen. Ethnographic research sends trained observers to watch and interact with consumers in their natural environment, revealing needs people would never mention in a survey because they take them for granted. Digital observation now includes analyzing website click paths, app usage and public social media conversations, which is often called social listening.
Survey research is the most widely used method for collecting descriptive information about people's knowledge, attitudes, preferences and buying behavior. Surveys can be run online, by phone, by mail or in person. Online panels make surveys fast and inexpensive, but they raise questions about whether panel members represent the wider population and whether some respondents are inattentive or even automated. Good practice includes attention checks, screening for fraudulent responses and comparing results with known benchmarks.
Experimental research tests cause and effect by selecting matched groups, giving them different treatments, controlling unrelated factors and comparing group responses. A test market launches a product in a few cities before a national roll-out. An online A/B test randomly shows half of website visitors one version of a page and half another. Because assignment is random, a large enough difference in outcomes can be attributed to the treatment rather than to differences between the groups.
Qualitative research explores motivations, feelings and language in depth. In-depth interviews talk with one person at a time for perhaps an hour. Focus groups bring together six to ten people with a trained moderator to discuss a product, service or idea. Qualitative findings are rich but cannot be generalized statistically to a population; they are best used to generate hypotheses, develop survey questions and understand the reasons behind quantitative results.
| Method | Best for | Main strengths | Main limitations |
|---|---|---|---|
| Secondary data | Background, market size, trends | Fast, cheap | May be outdated, irrelevant or biased |
| Observation and ethnography | Actual behavior, unspoken needs | Shows what people do, not what they say | Cannot see motives; can be costly |
| Surveys | Attitudes, preferences, descriptive data | Flexible, scalable | Self-report bias; sample quality |
| Experiments and A/B tests | Cause and effect | Strongest evidence of causation | Need traffic, time and careful design |
| Interviews and focus groups | Motivations, language, ideas | Depth and nuance | Small, non-representative samples |
Sampling
A sample is a segment of the population selected to represent the population as a whole. Three decisions are involved: who is to be surveyed (the sampling unit), how many people (the sample size) and how they are to be chosen (the sampling procedure). In probability samples, each population member has a known chance of being included, which allows researchers to calculate sampling error. Simple random samples, stratified samples (random samples within groups such as regions) and cluster samples are common types. In non-probability samples, such as convenience samples and quota samples, the chance of selection is unknown. Non-probability samples are cheaper and often adequate for exploratory work, but results cannot be projected with known precision.
For a probability sample, the margin of error for a proportion depends mainly on the sample size, not the population size. That surprises many people: a well-drawn random sample of about 1,000 gives roughly the same precision whether the population is a city of 500,000 or a country of 40 million. Sample size for a desired margin of error can be estimated with a standard formula, where z is 1.96 for 95 % confidence, p is the expected proportion (0.5 gives the most conservative estimate) and e is the margin of error.
Worked problem
Choosing a survey sample size
A regional grocer wants to estimate the share of households in its trading area that would use a same-day delivery service, to within ±3 percentage points at 95 % confidence. It has no prior estimate. How many completed responses does it need, and how many invitations should it send if it expects a 20 % response rate?
Show solution
- Use p = 0.5 because there is no prior estimate, z = 1.96 and e = 0.03.
- n = 1.96² × 0.5 × 0.5 ÷ 0.03² = 3.8416 × 0.25 ÷ 0.0009 ≈ 1,067.
- Invitations needed = 1,067 ÷ 0.20 ≈ 5,335.
- If ±5 points were acceptable, n = 3.8416 × 0.25 ÷ 0.0025 ≈ 384, about a third of the cost.
- The margin of error covers sampling error only; it does not correct for a biased sample or badly worded questions.
Answer: About 1,070 completed responses, or roughly 5,300 invitations, are needed for ±3 points. Relaxing precision to ±5 points cuts the sample to about 384.
Designing questionnaires
Question design strongly affects the answers. Questions should be clear, neutral, specific and answerable. Leading questions ('Don't you agree that our new design is more attractive?') push respondents toward an answer. Double-barrelled questions ('How satisfied are you with our prices and service?') ask two things at once. Questions about the distant past or hypothetical behavior ('Would you buy this product if it existed?') tend to produce optimistic answers, because saying yes costs nothing. Researchers often discount stated purchase intentions heavily when forecasting.
Closed-ended questions, such as multiple-choice and rating scales, are easy to analyze. A Likert scale asks respondents how strongly they agree or disagree with a statement, often on a five- or seven-point scale. Open-ended questions let respondents answer in their own words, revealing ideas researchers did not anticipate; generative AI tools now help code large numbers of open-ended answers into themes, although human review remains important. The order of questions also matters: general questions usually come before specific ones, and sensitive questions near the end.
| Problem | Poor question | Better question |
|---|---|---|
| Leading | How much did you enjoy our friendly staff? | How would you rate the friendliness of our staff, from 1 (very unfriendly) to 5 (very friendly)? |
| Double-barrelled | Was the delivery fast and reliable? | Two questions: one on speed, one on reliability |
| Vague time frame | Do you eat out often? | In the past 7 days, how many times did you eat a meal from a restaurant? |
| Hypothetical optimism | Would you buy this if it existed? | Show a realistic concept and price, then ask likelihood to buy on a 5-point scale, and discount the results |
| Jargon | Do you prefer omnichannel fulfillment? | Would you prefer to order online and pick up in store, or have items delivered? |
Digital analytics and experiments
Digital channels generate huge volumes of behavioral data. Web and app analytics track visits, sources of traffic, pages viewed, time spent, actions taken and conversions. Customer relationship management systems record each customer's purchases and interactions. Marketing automation platforms record email opens and clicks. The challenge is less collecting data than deciding which metrics matter and avoiding vanity metrics, such as raw page views or follower counts, that look impressive but do not connect to business outcomes.
A/B testing applies the logic of experiments to digital marketing. The firm randomly assigns visitors to version A (the control) or version B (the variation), measures a specific outcome such as the conversion rate and checks whether the difference is larger than chance would explain. A common test for comparing two conversion rates is the two-proportion z-test. The p-value is the probability of seeing a difference at least this large if there were really no difference; a p-value below 0.05 is conventionally treated as statistically significant. Statistical significance is not the same as practical importance: a tiny but significant improvement may not be worth the cost of change.
import math, random

random.seed(220)
# Simulated A/B test: 6,000 visitors per version
n_a, n_b = 6000, 6000
true_a, true_b = 0.040, 0.047          # unknown in real life
conv_a = sum(random.random() < true_a for _ in range(n_a))
conv_b = sum(random.random() < true_b for _ in range(n_b))

p_a, p_b = conv_a / n_a, conv_b / n_b
p_pool = (conv_a + conv_b) / (n_a + n_b)
se = math.sqrt(p_pool * (1 - p_pool) * (1 / n_a + 1 / n_b))
z = (p_b - p_a) / se
p_value = 2 * (1 - 0.5 * (1 + math.erf(abs(z) / math.sqrt(2))))

print(f"A: {conv_a} of {n_a} = {p_a:.2%}")
print(f"B: {conv_b} of {n_b} = {p_b:.2%}")
print(f"Relative lift = {(p_b - p_a) / p_a:+.1%}")
print(f"z = {z:.2f}, two-sided p-value = {p_value:.3f}")
print("Significant at 5 %" if p_value < 0.05 else "Not significant at 5 %")A: 224 of 6000 = 3.73% B: 307 of 6000 = 5.12% Relative lift = +37.1% z = 3.68, two-sided p-value = 0.000 Significant at 5 %
Common A/B testing mistakes include stopping a test as soon as the result looks significant (which inflates false positives), running many tests at once and reporting only the winners, testing with too little traffic to detect realistic differences, and ignoring effects that take time to show up, such as returns or cancellations. Many firms decide sample size and test duration in advance and stick to them.
Worked problem
Interpreting an A/B test by hand
An online retailer tests two checkout pages. Version A converts 240 of 6,000 visitors (4.0 %); version B converts 282 of 6,000 (4.7 %). Is the difference statistically significant at the 5 % level, and is it worth implementing if each extra order earns $18 of margin and the site gets 50,000 checkout visitors a month?
Show solution
- Pooled rate = (240 + 282) ÷ 12,000 = 0.0435.
- Standard error = √(0.0435 × 0.9565 × (1/6,000 + 1/6,000)) ≈ √(0.0416 × 0.000333) ≈ 0.00373.
- z = (0.047 − 0.040) ÷ 0.00373 ≈ 1.88, which gives a two-sided p-value of about 0.06.
- The result is not quite significant at 5 %; the team might extend the test to gather more data.
- If the lift is real, extra orders = 50,000 × 0.007 = 350 a month, worth 350 × $18 = $6,300 of margin a month, so the potential prize justifies continuing the test.
Answer: The difference is suggestive (p ≈ 0.06) but not conclusive. Because a true 0.7-point lift would be worth about $6,300 a month, extending the test is sensible.
Estimating market size
Before investing in a product or market, firms estimate how large the opportunity is. A common framework distinguishes three nested figures. The total addressable market (TAM) is total demand for the product category if every possible customer bought. The serviceable available market (SAM) is the part of the TAM the firm's offer can actually serve, given its product, geography and channels. The serviceable obtainable market (SOM) is the share of the SAM the firm can realistically win in the planning period, given competition and its resources. Investors are often skeptical of plans that jump straight from a huge TAM to an assumed small percentage of it; a bottom-up estimate built from customer numbers, purchase rates and prices is more convincing.
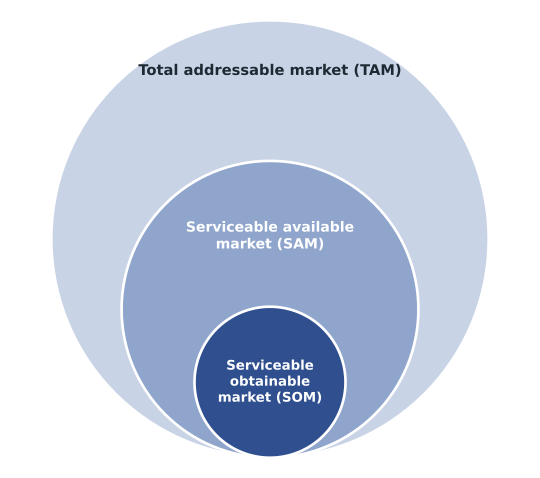
Worked problem
A bottom-up market size estimate
A start-up plans an app-based dog-walking service in one metropolitan area with about 1.2 million households. Research suggests 30 % of households own a dog, 15 % of dog-owning households currently pay for dog walking, and those households spend an average of $1,800 a year on it. The start-up can initially serve only the central districts, which hold 40 % of the area's households, and believes it can win 10 % of paying customers there within three years. Estimate TAM, SAM and SOM in annual revenue.
Show solution
- Dog-owning households = 1,200,000 × 0.30 = 360,000.
- Households paying for dog walking = 360,000 × 0.15 = 54,000.
- TAM (paid dog walking in the metro area) = 54,000 × $1,800 = $97.2 million a year.
- SAM (central districts only) = $97.2 million × 0.40 ≈ $38.9 million.
- SOM (10 % share within three years) ≈ $3.9 million a year.
- Sensitivity: if only 10 % of owners pay for walking, every figure falls by a third; testing assumptions matters.
Answer: TAM ≈ $97 million, SAM ≈ $39 million and SOM ≈ $3.9 million a year. The estimate is only as good as its assumptions, so each input should be checked with research.
Ethics, privacy and first-party data
Marketing research depends on public trust. Research industry codes, such as the Insights Association Code of Standards and Ethics and the international ICC/ESOMAR Code, require researchers to be honest with participants, to obtain informed consent, to protect personal data and to keep research separate from selling. 'Sugging', selling under the guise of research, and 'frugging', fundraising under the guise of research, are considered unethical. In law, there is no single federal consumer privacy statute, but the FTC polices unfair and deceptive data practices, the Children's Online Privacy Protection Act protects children under 13, and a growing number of states, led by California, give consumers rights to know, delete and opt out of the sale or sharing of personal information. BUS-210 lesson 11 explains the current law.
Changes in technology and regulation have pushed marketers toward first-party data, information customers share directly with the firm through purchases, accounts, loyalty programs, surveys and website interactions, and zero-party data, which customers proactively and intentionally share, such as preferences in a style quiz. Third-party data bought from brokers and collected by tracking people across other sites faces more legal and reputational risk, and browser and phone makers have restricted tracking. Building a trusted value exchange, where customers understand what they share and what they get in return, has become a strategic priority.
Analytics also raise fairness issues. Models that predict who will respond to an offer can unintentionally exclude groups, and price-personalization based on inferred characteristics can feel exploitative. Responsible teams document how data is used, test models for unfair outcomes and ask whether customers would be comfortable if they knew how their data was being used.
Common mistakes
MistakeJumping into a survey before defining the decision it will inform.
InsteadStart with the management decision and specific research questions; check secondary data first.
MistakeTreating focus group opinions as representative of the market.
InsteadUse qualitative research to explore ideas, then test them with a properly sampled quantitative study.
MistakeBelieving a bigger population needs a much bigger sample.
InsteadFor a random sample, precision depends mainly on sample size; about 1,000 gives ±3 points.
MistakeStopping an A/B test the moment results look significant.
InsteadSet sample size and duration in advance and analyze once the test is complete.
MistakeTaking stated purchase intentions at face value.
InsteadDiscount intentions heavily and, where possible, test with real behavior.
MistakeCollecting all the customer data possible "just in case".
InsteadCollect what you need with meaningful consent, and explain the value customers receive.
Summary and key terms
- Marketing research is the systematic design, collection, analysis and reporting of data for a marketing decision.
- Research can be exploratory, descriptive or causal; defining the problem is the most important step.
- Secondary data is fast and cheap but must be checked for relevance, currency, accuracy and comparable definitions.
- Primary methods include observation, surveys, experiments and qualitative interviews and focus groups.
- Probability samples allow known margins of error; n = z²p(1 − p) ÷ e² gives about 1,067 for ±3 points.
- Question wording, order and format strongly affect answers.
- A/B tests use random assignment to establish cause and effect; significance is not the same as practical value.
- TAM, SAM and SOM size an opportunity; bottom-up estimates are more credible.
- Research codes and privacy laws require honesty, consent and data protection; first-party data is increasingly important.
- Marketing research
- The systematic design, collection, analysis and reporting of data relevant to a marketing situation.
- Secondary data
- Information that already exists, collected for another purpose.
- Primary data
- Information collected for the specific purpose at hand.
- Ethnographic research
- Observing and interacting with consumers in their natural environment.
- Probability sample
- A sample in which each population member has a known chance of selection.
- Margin of error
- The range within which the true population value is likely to fall, given sampling error.
- A/B test
- An experiment that randomly assigns users to two versions and compares outcomes.
- p-value
- The probability of a result at least as extreme as observed if there were no real difference.
- Total addressable market
- Total demand for a product category if every possible customer bought.
- First-party data
- Data customers share directly with a firm through their interactions with it.
Practice problems
Work each problem on paper first, then reveal the answer to check.
Distinguish exploratory, descriptive and causal research.
Show answer
Exploratory defines problems; descriptive describes markets; causal tests cause and effect.
Give two questions to ask when evaluating secondary data.
Show answer
Is it current? Is it impartial? Are definitions comparable?
Why might observation reveal needs that a survey misses?
Show answer
People do not mention behavior they take for granted or cannot articulate.
What sample size is needed for ±4 points at 95 % confidence with p = 0.5?
Show answer
1.96² × 0.25 ÷ 0.0016 ≈ 600.
What is wrong with "How satisfied are you with our price and quality?"
Show answer
It is double-barrelled.
Version A converts 3.0 % and B 3.6 %; p = 0.02. What can you conclude?
Show answer
The difference is statistically significant at 5 %; check whether it is practically worthwhile.
Why is stopping an A/B test early a problem?
Show answer
It inflates the chance of a false positive.
A city has 400,000 households; 5 % might buy a $600 product once. What is the TAM?
Show answer
20,000 × $600 = $12 million.
What is sugging?
Show answer
Selling under the guise of research.
Portfolio task: design five unbiased survey questions to test interest in a new service.
Show answer
Answers vary; questions should be clear, neutral, single-issue and specific.
Lesson quiz · 5 questions
Score 60% or more to complete this lesson.
Create a free account to save your progress, take quizzes and earn a certificate.